

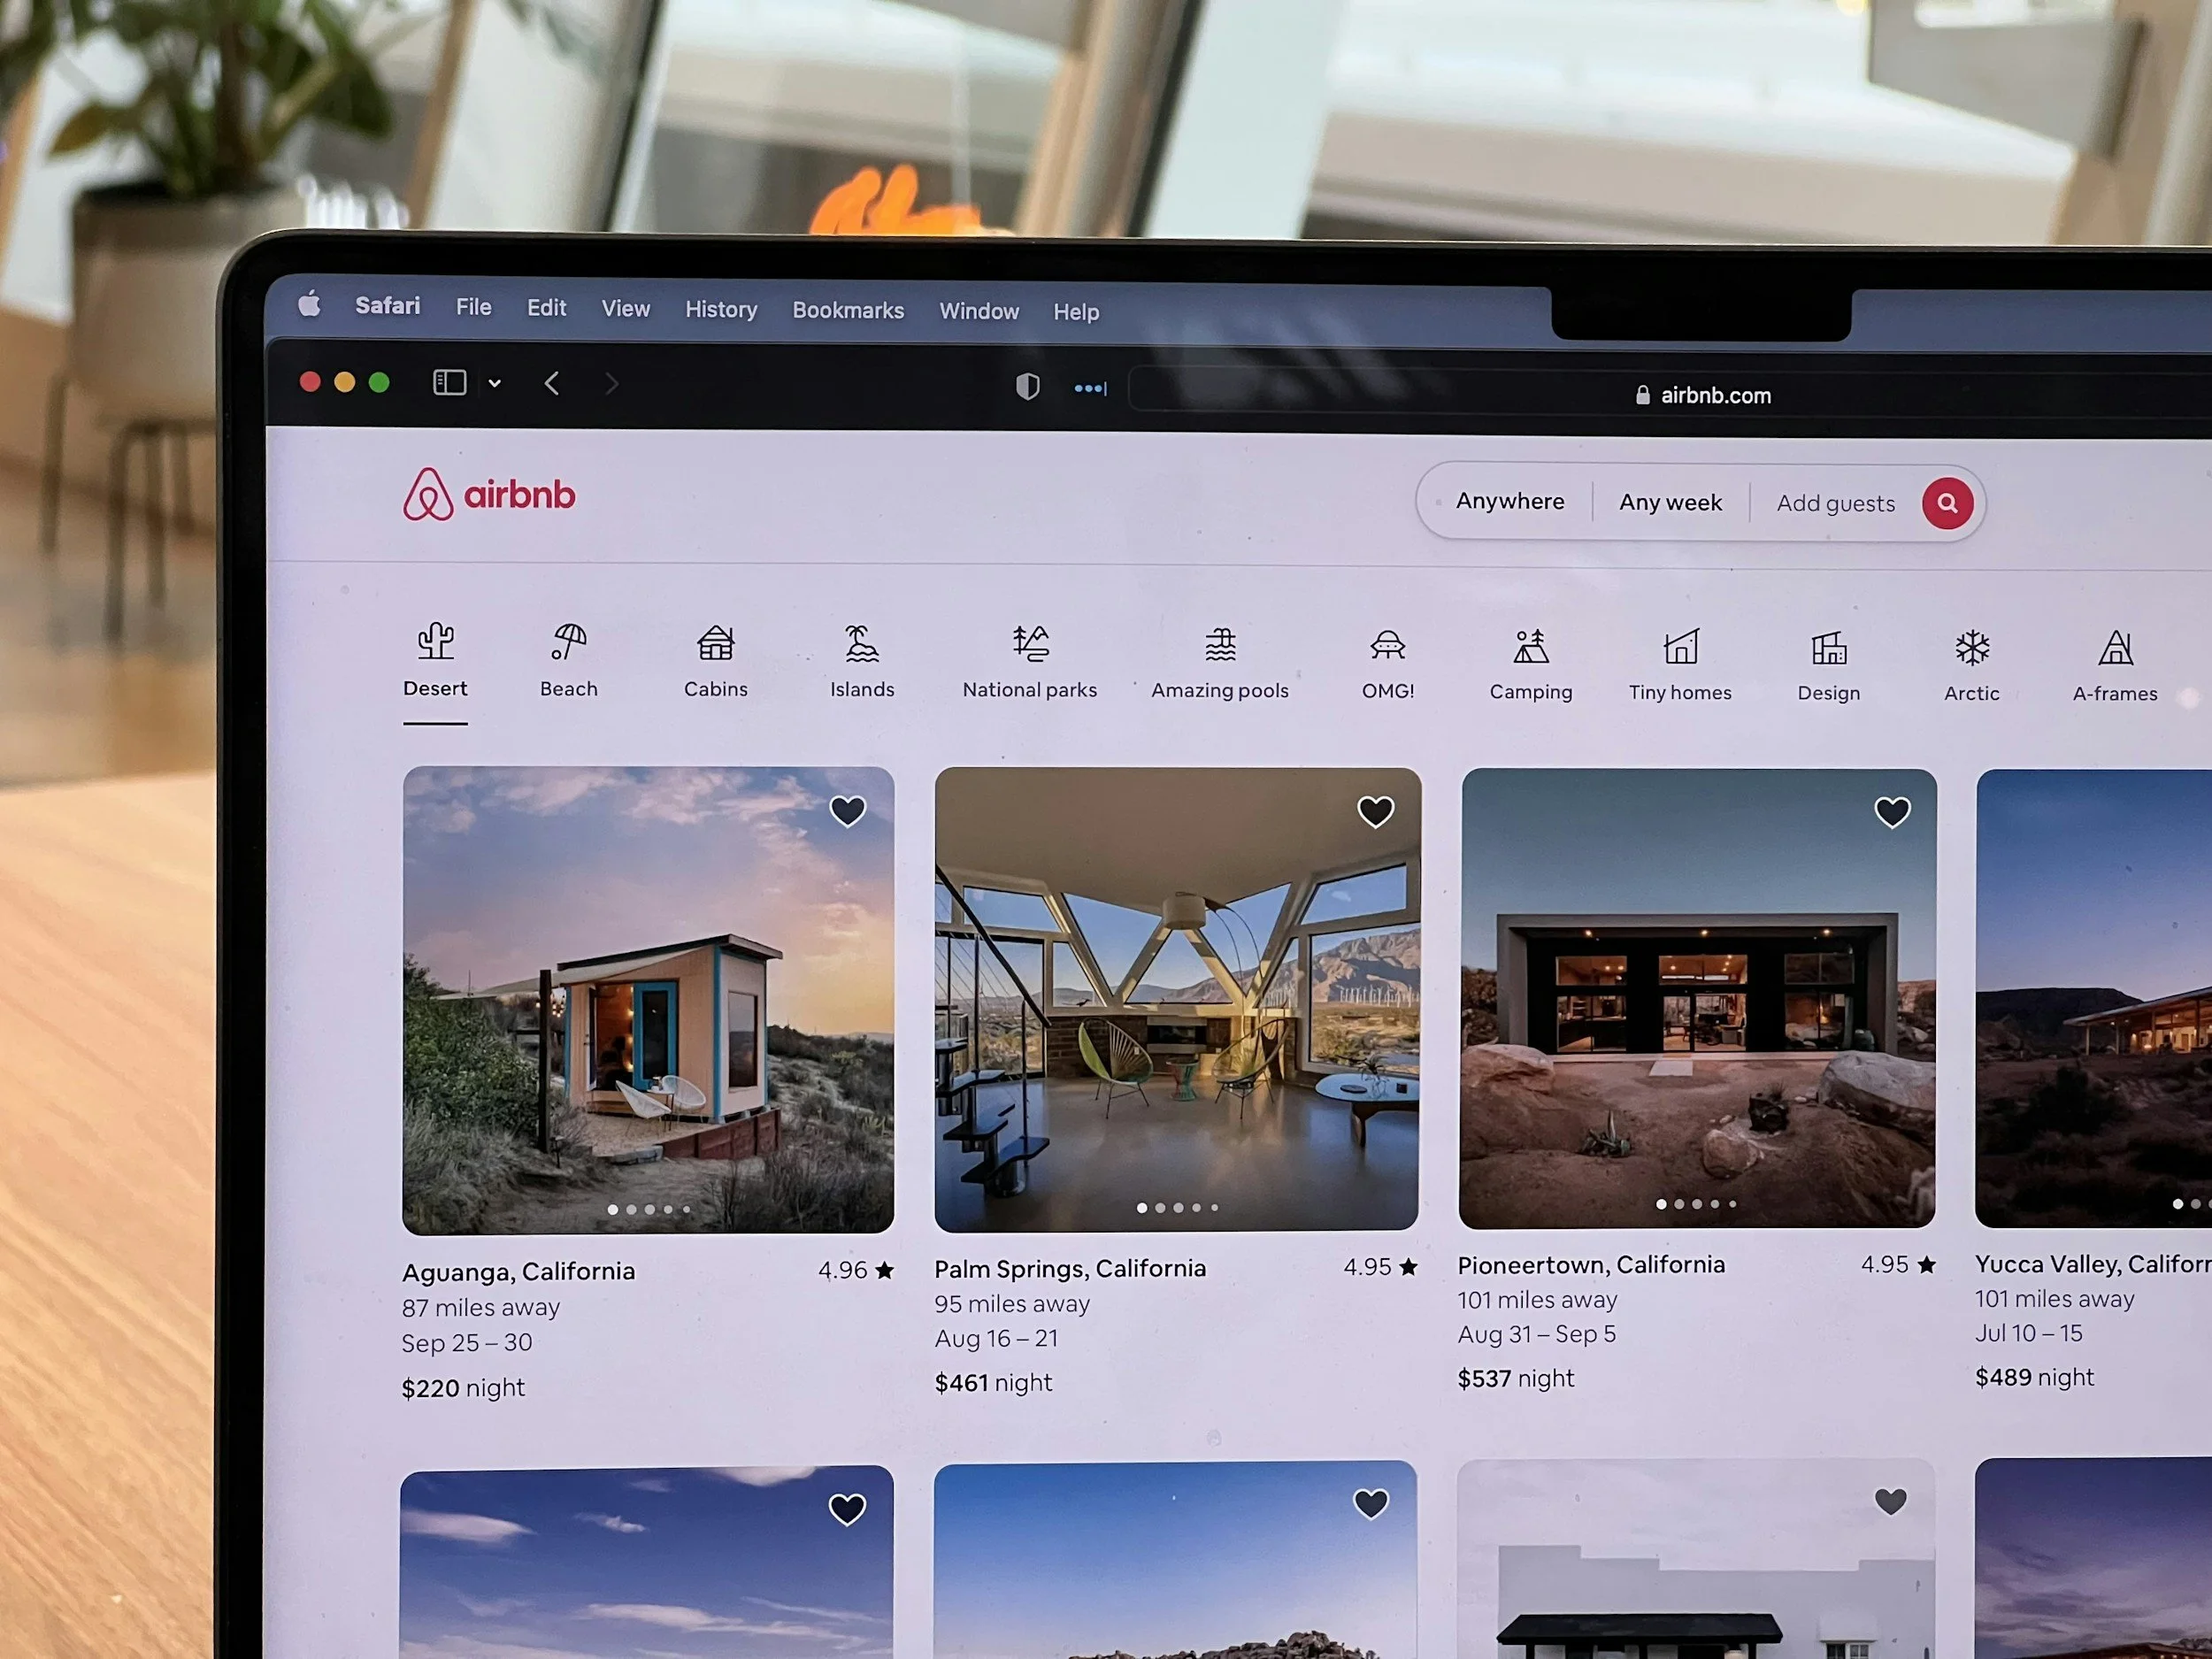
See What Your Listing Could Be Doing
Trusted by Hosts Worldwide
What Actually Moves the Needle

Positioning
Who the property is for and why guests choose it

Pricing
Rates that capture demand and maximize revenue
Presentation
Photos and content that convert views into bookings

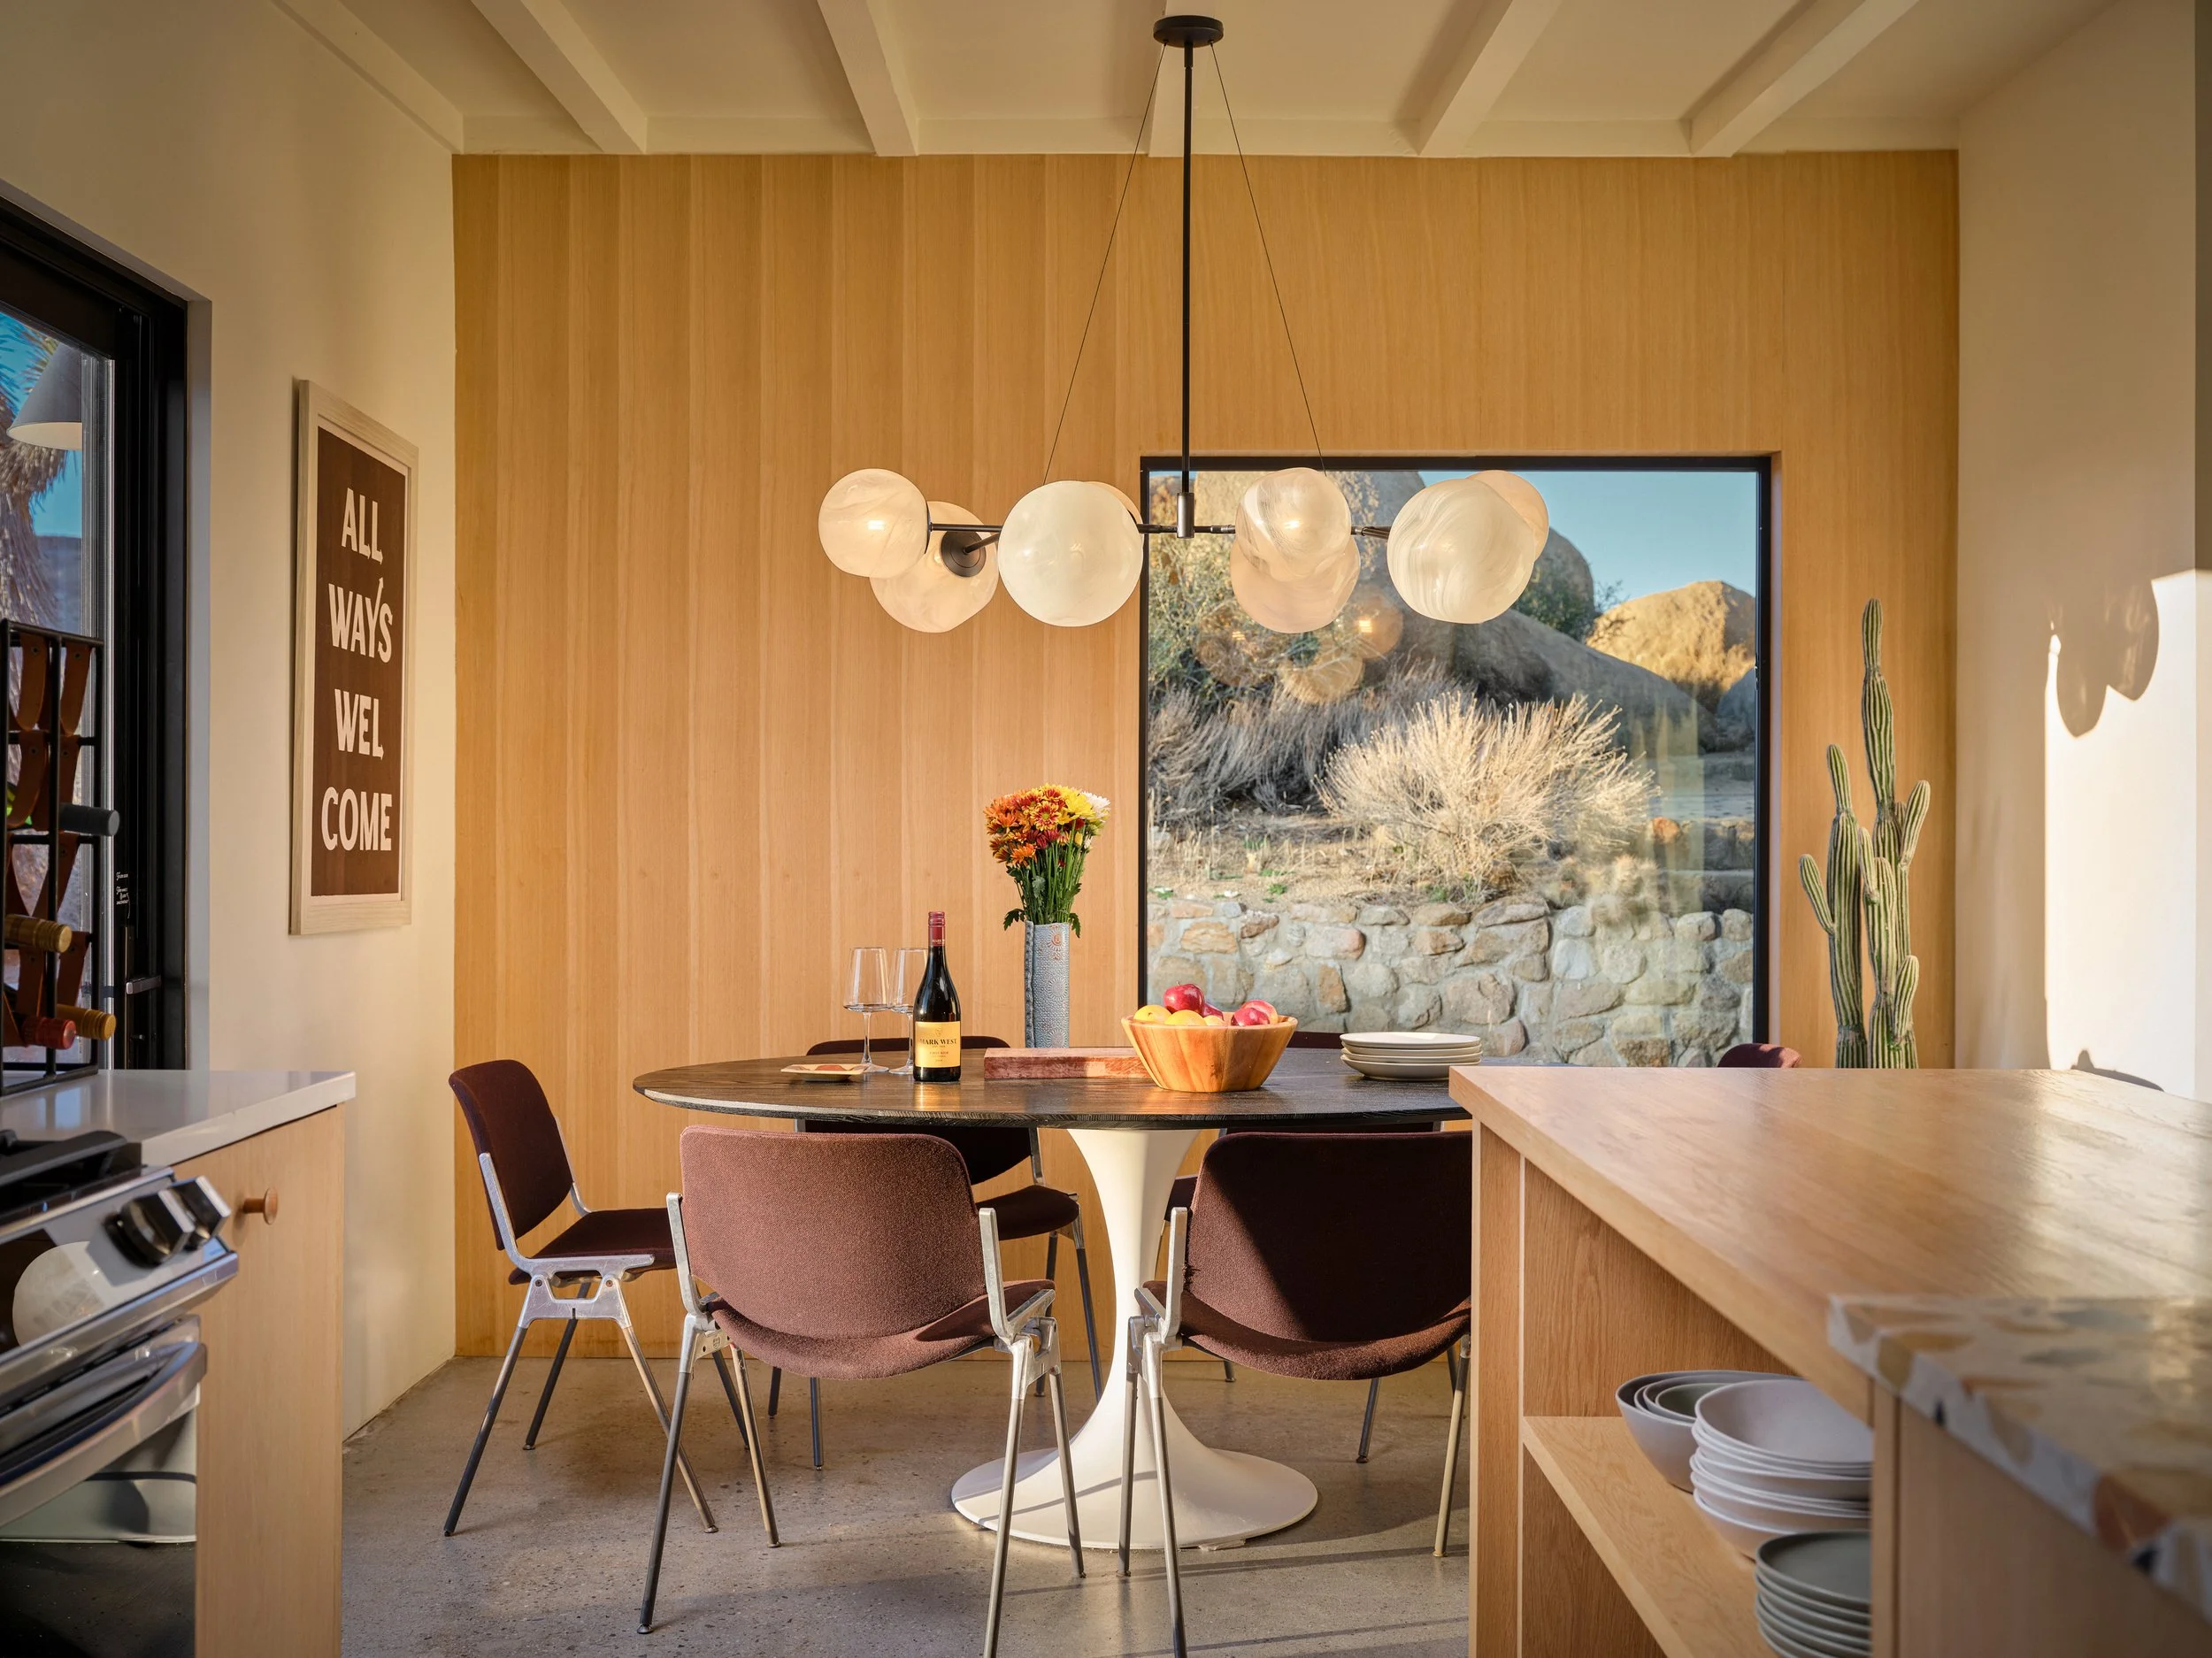
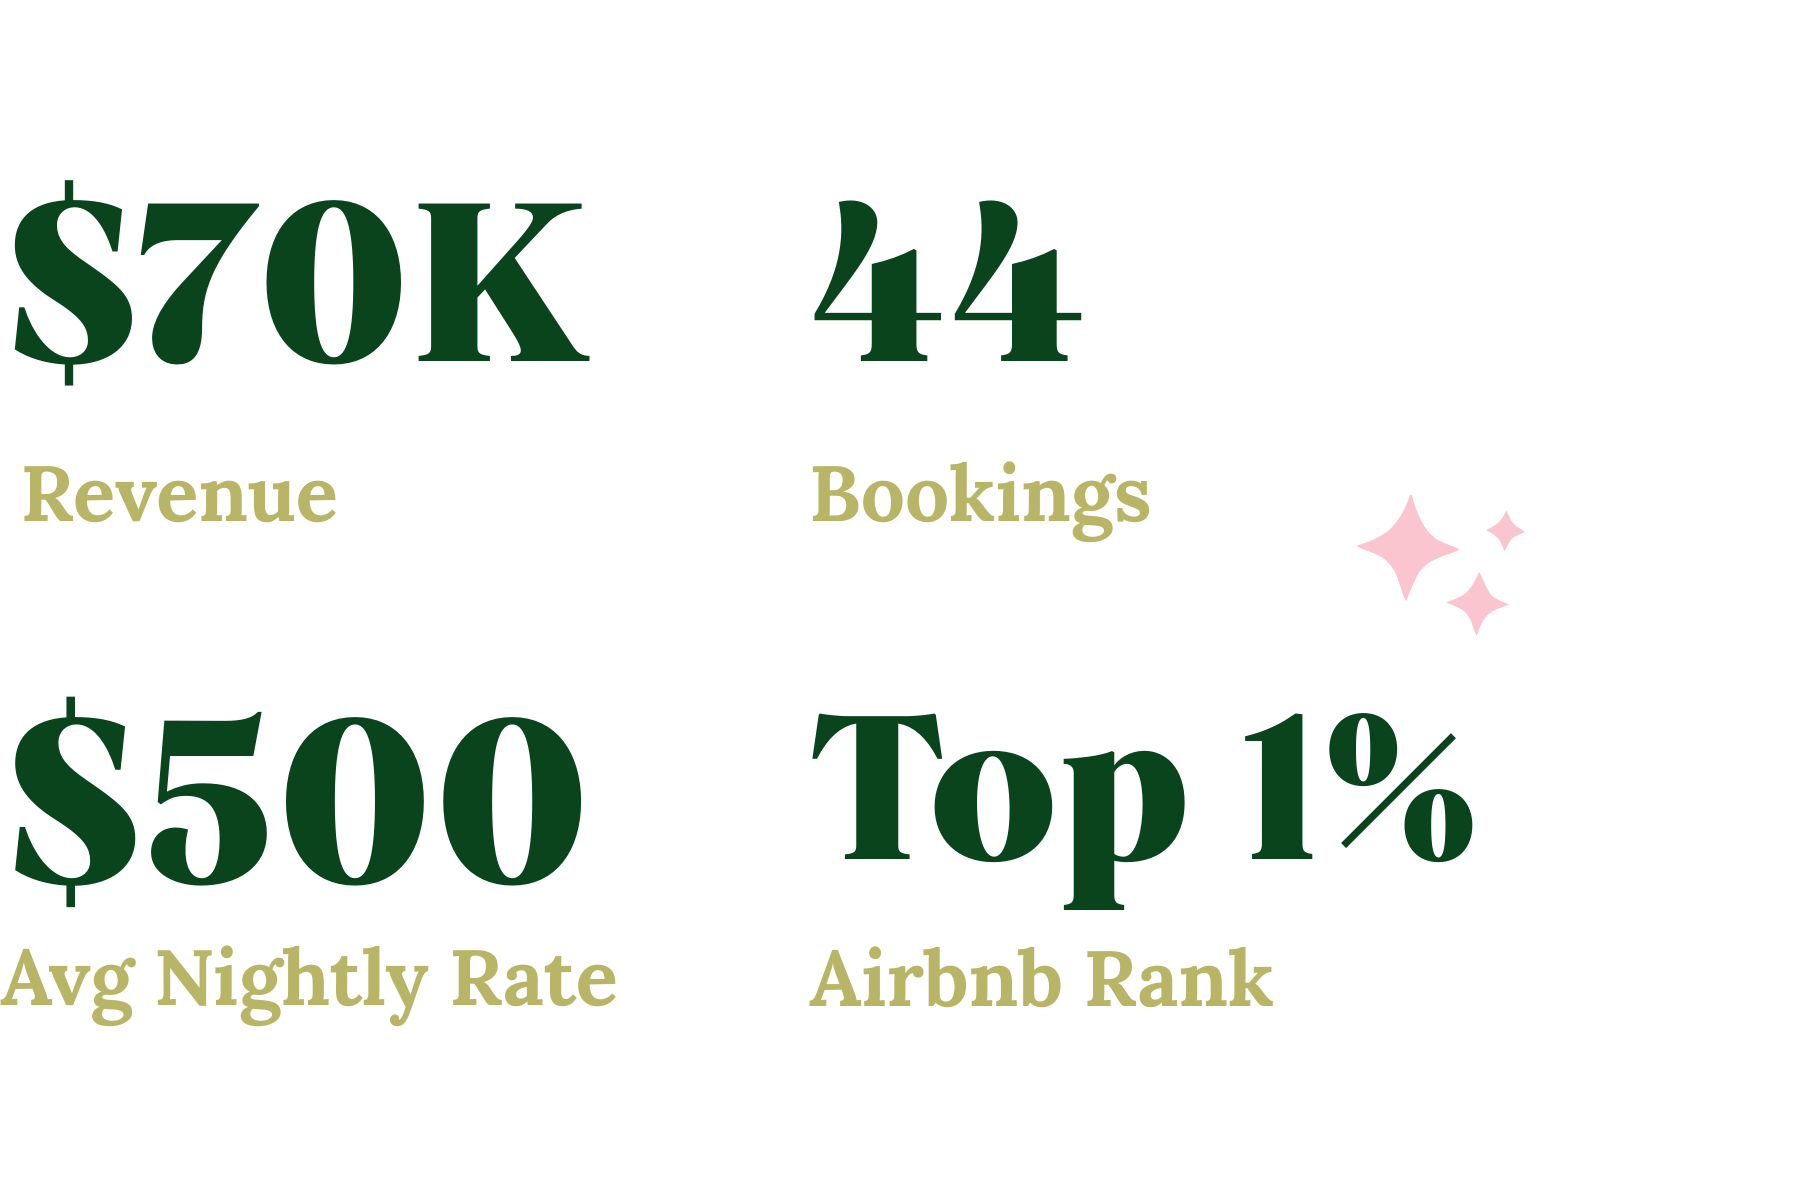
Case Study #1
Swim Rock House
Joshua Tree, California
New listing to top 1% in 2 months
When the new owner purchased this Joshua Tree property, the goal was clear: launch quickly and compete with the top homes in the market.
Because Airbnb listings cannot transfer between owners, the property had to start completely from scratch. We built the listing from the ground up, implementing a full optimization strategy across pricing, positioning, and guest experience to establish strong performance from day one.
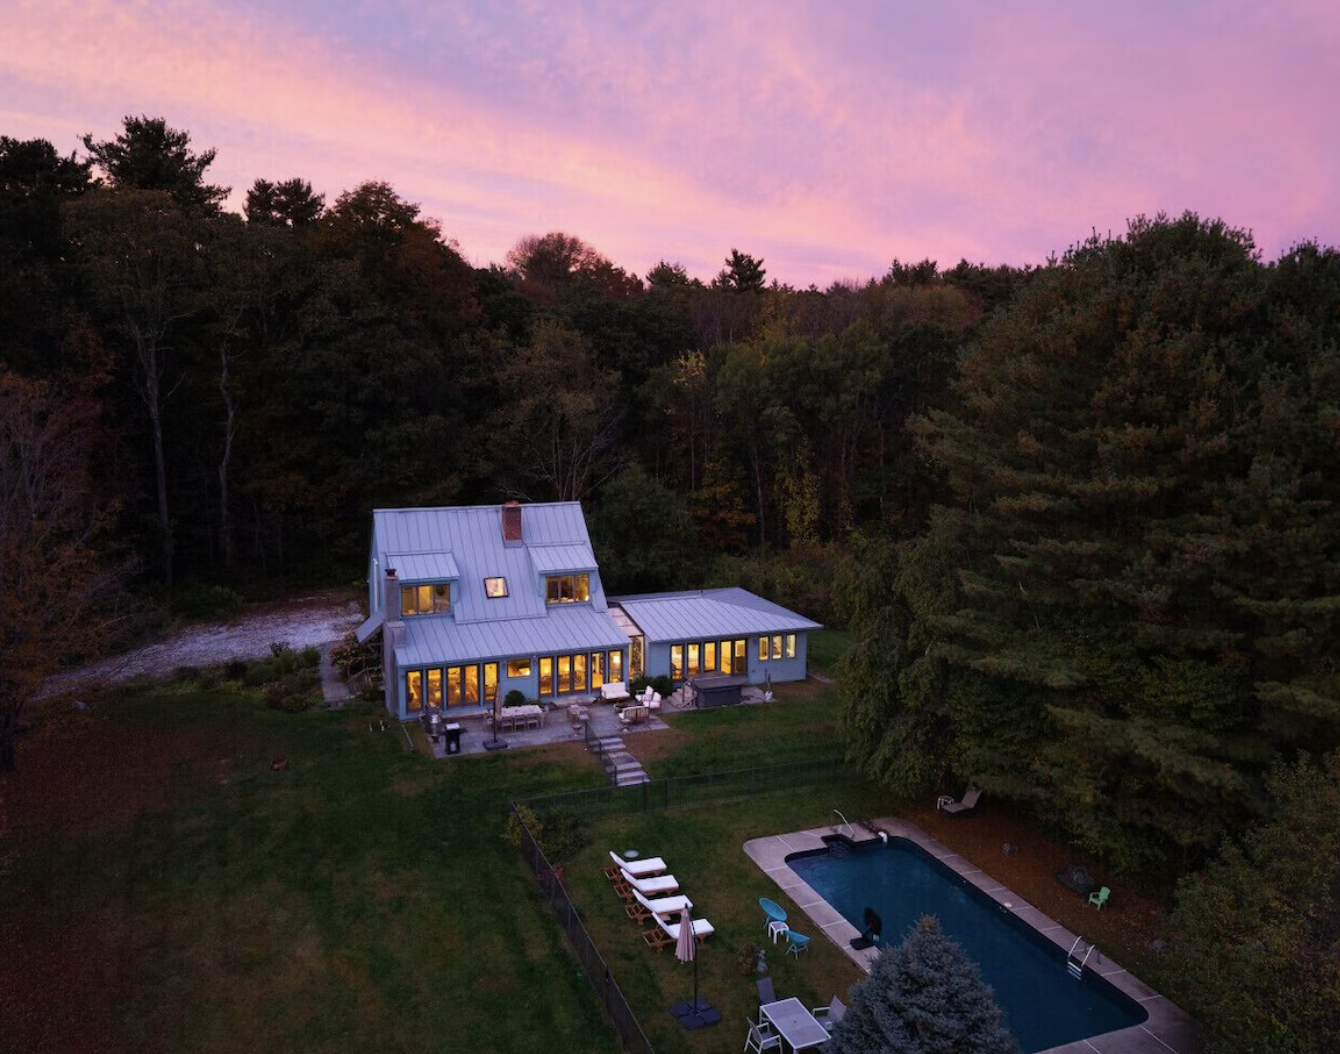
Case Study #2
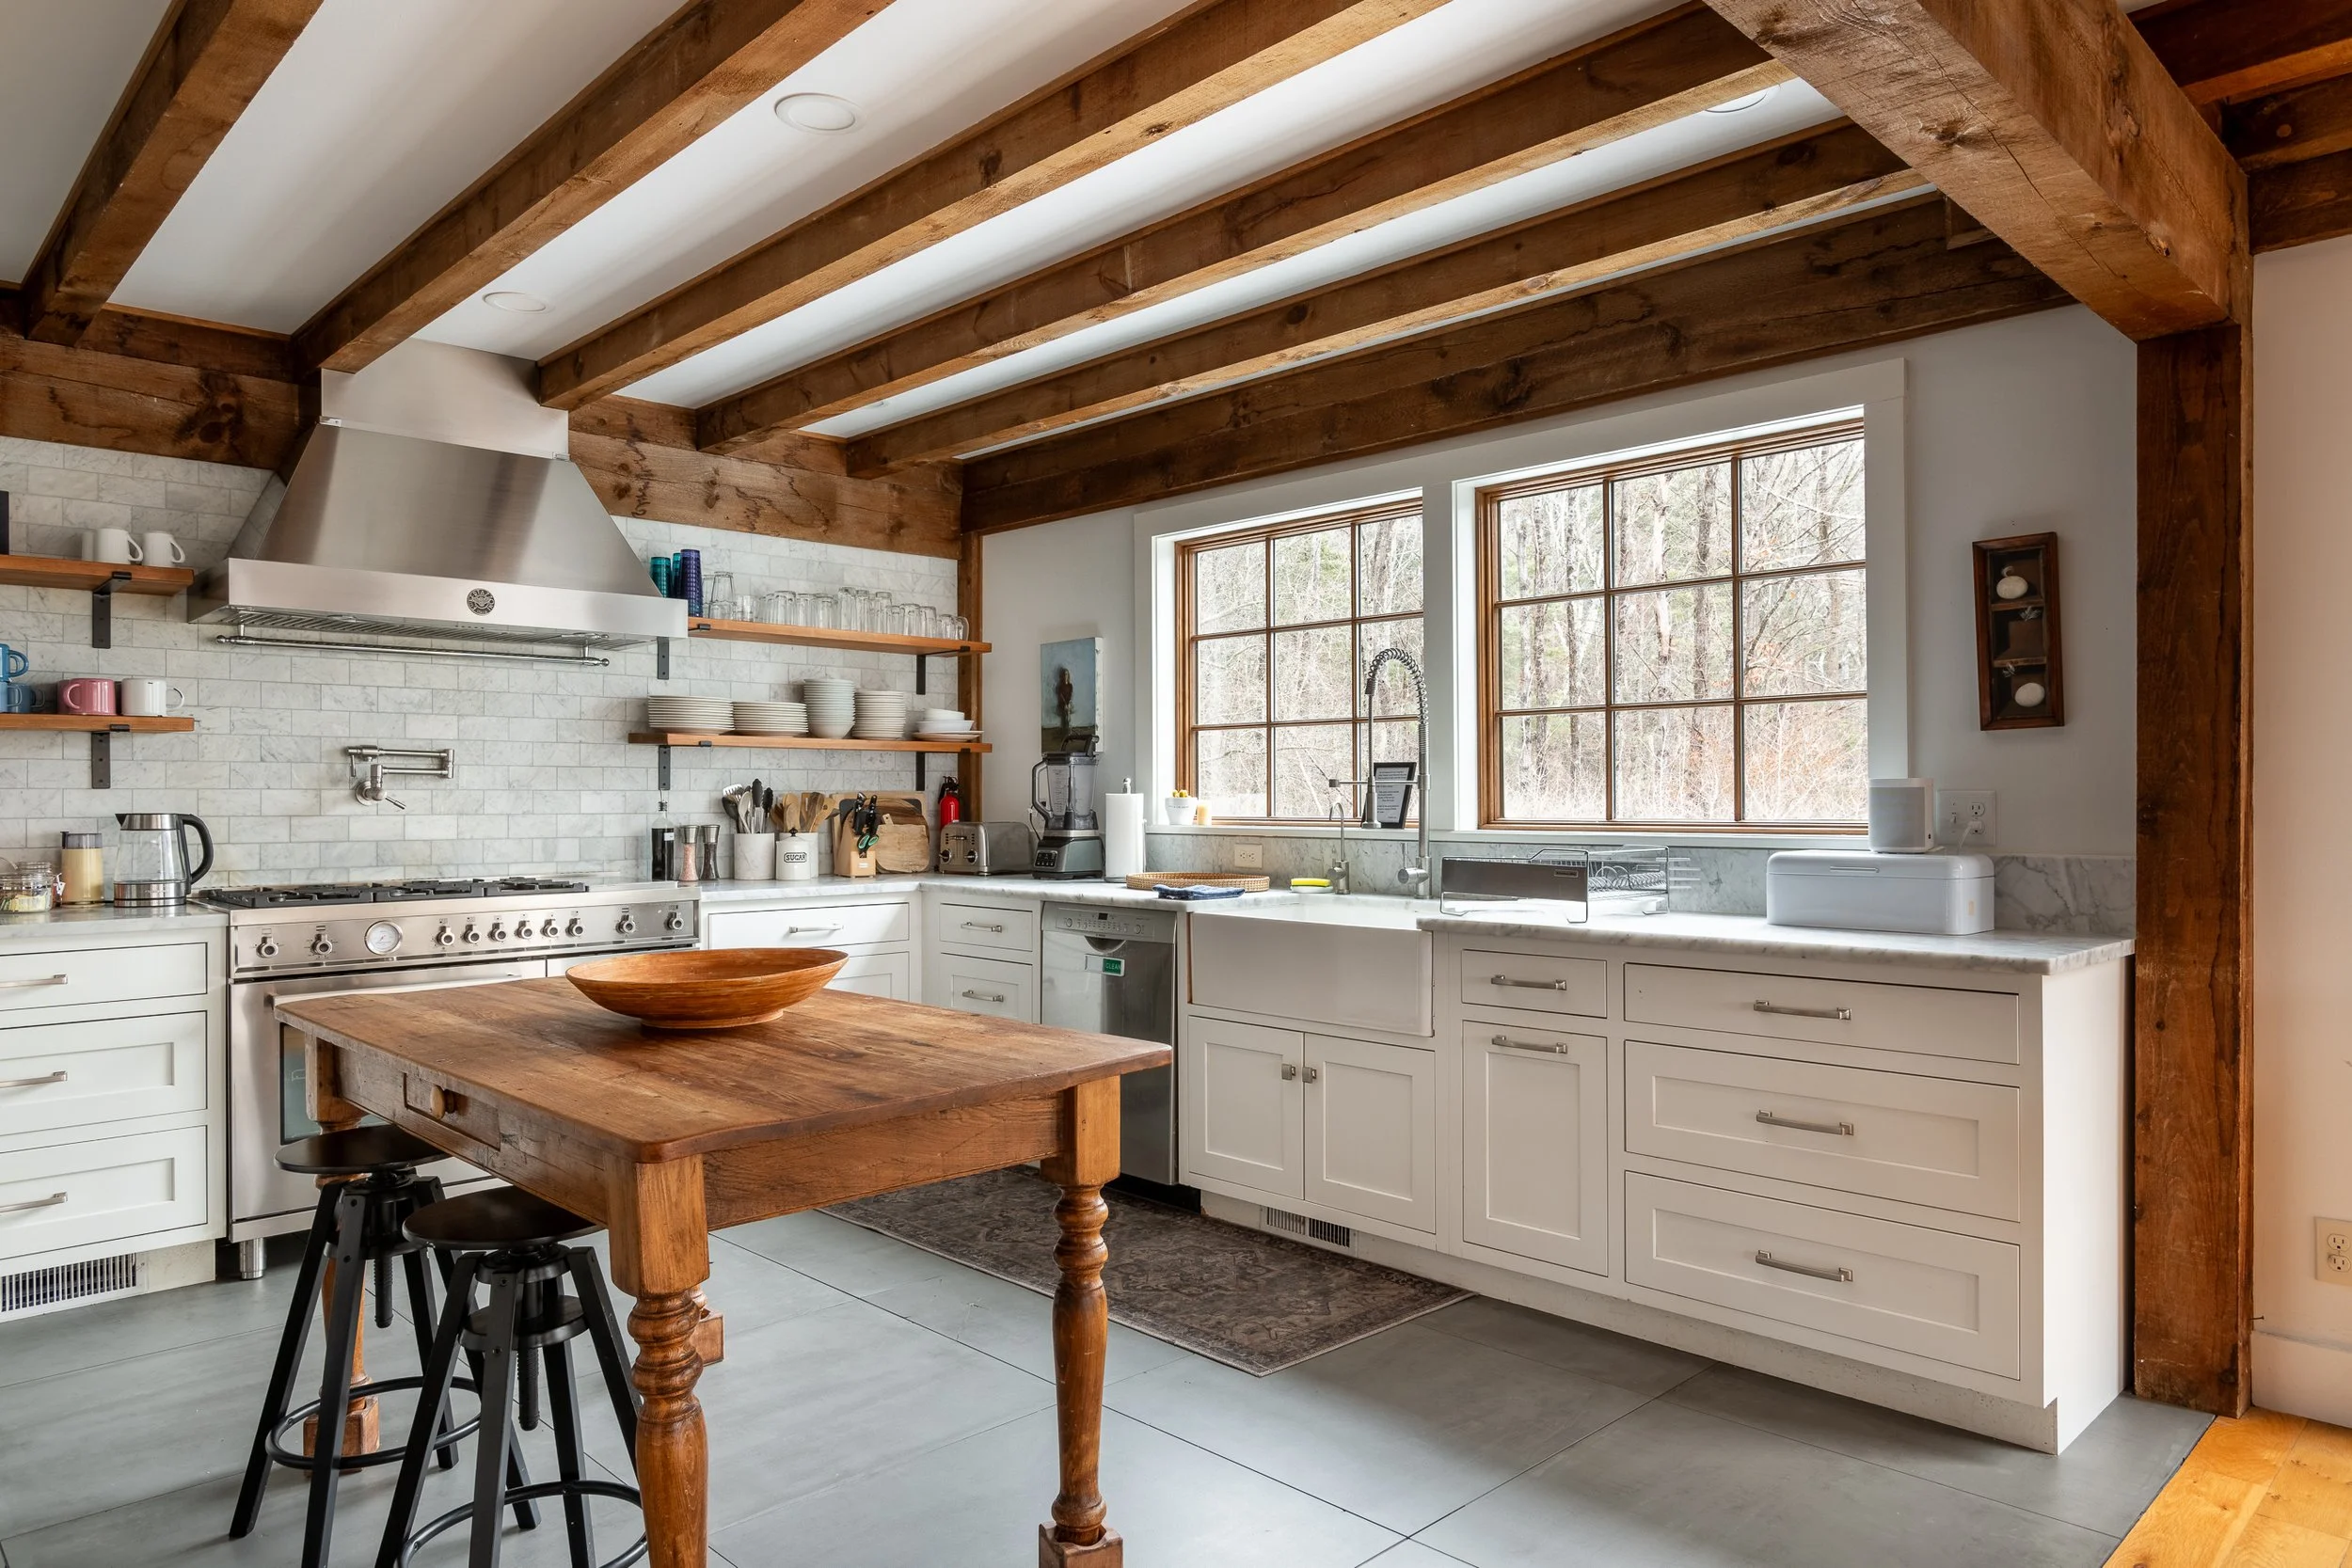
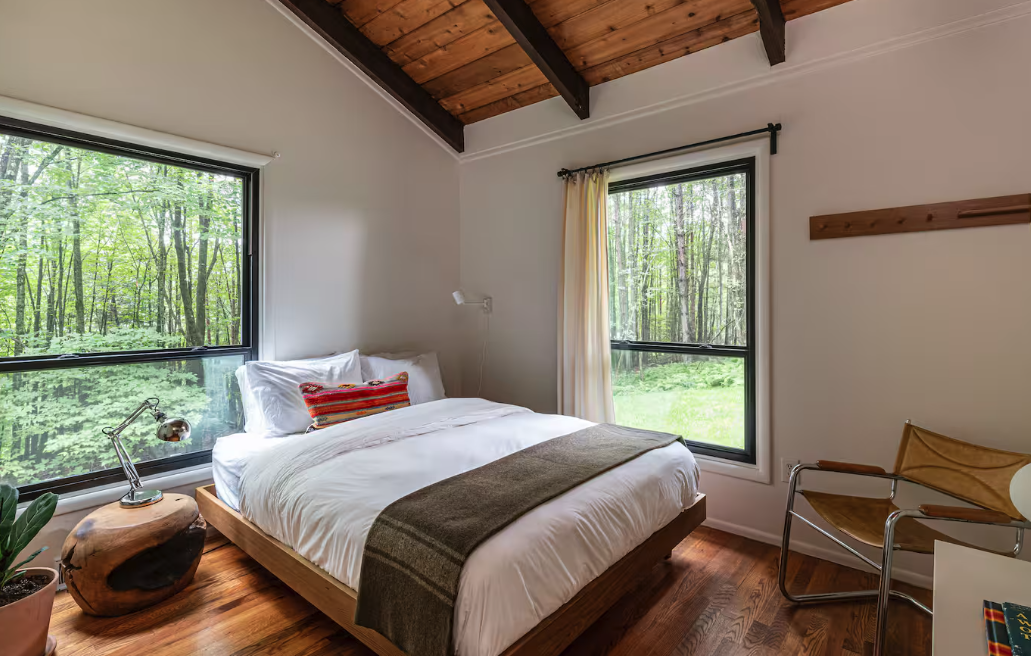
Berkshires Getaway
Egremont, Massachusetts
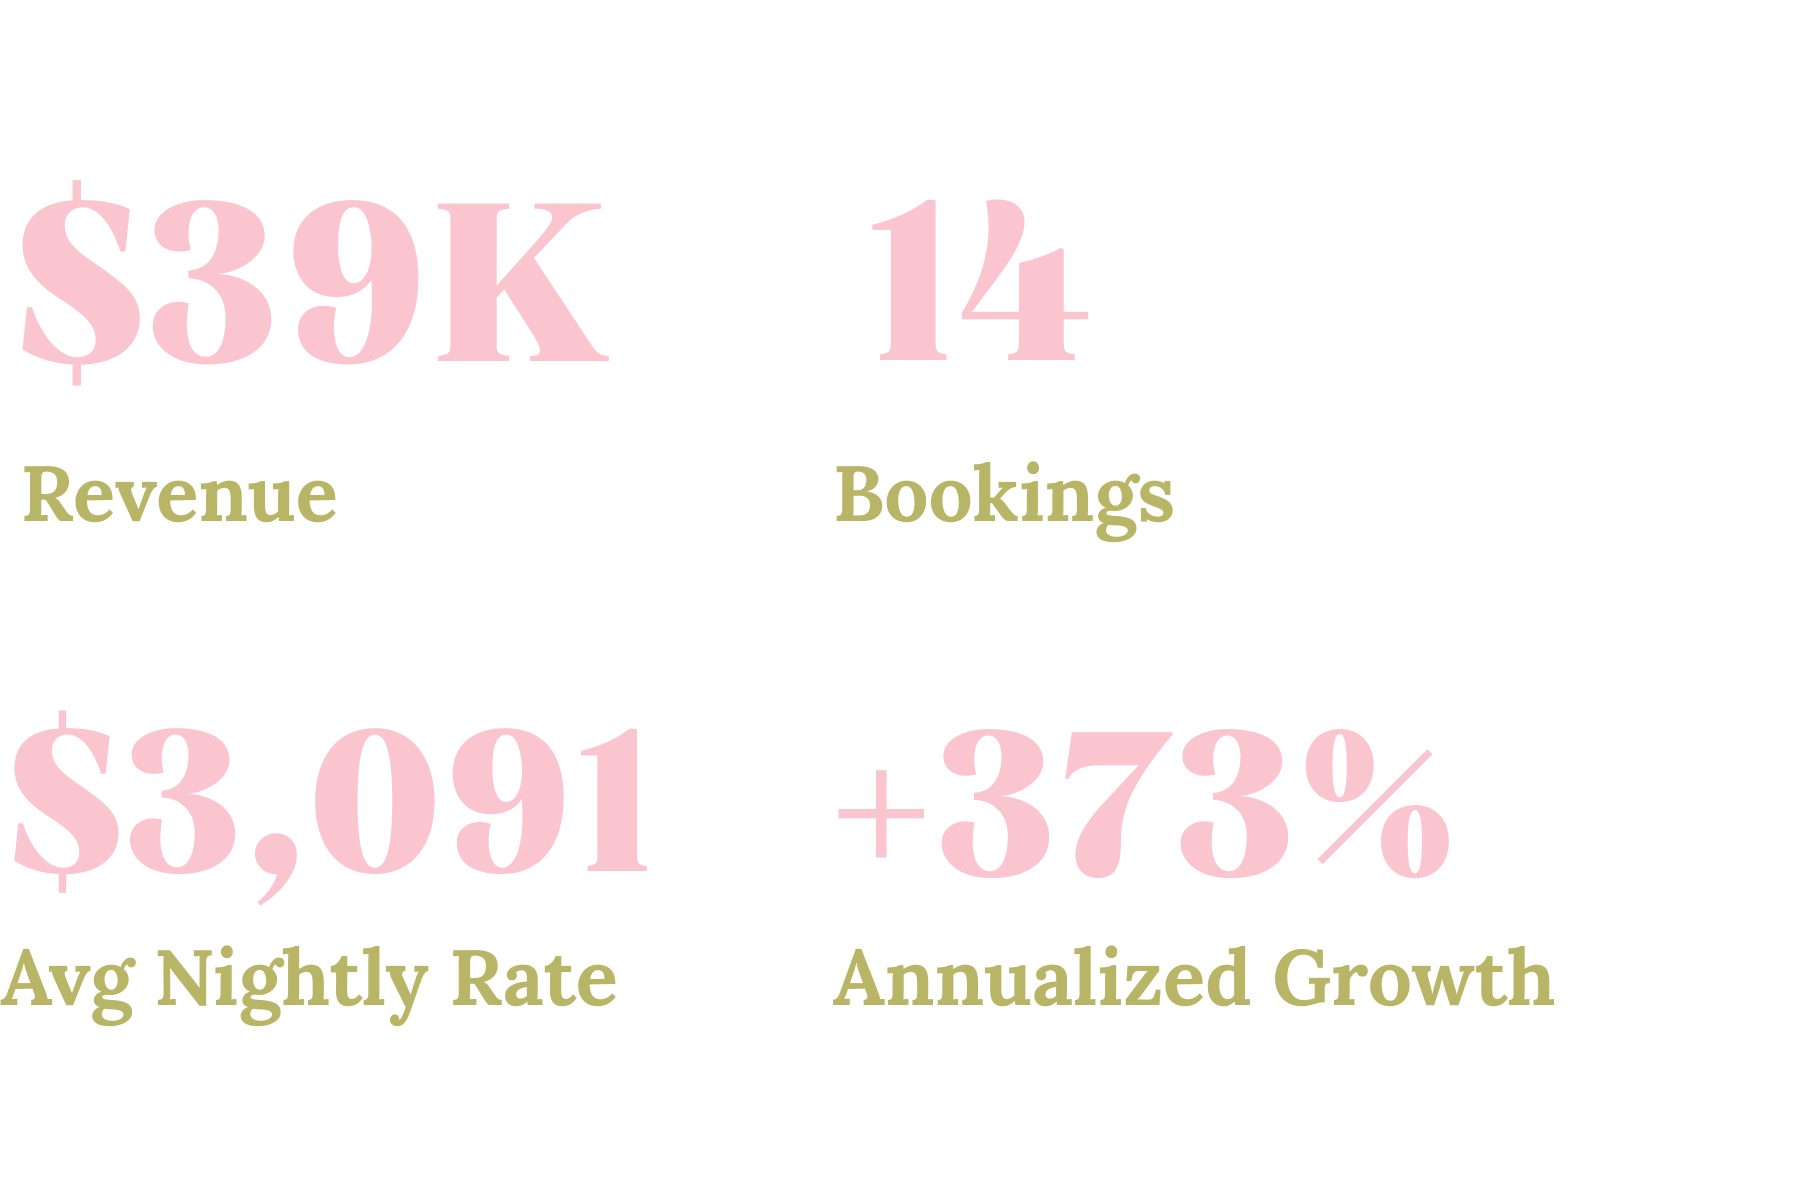
Inconsistent bookings to $238K trajectory
When the owners of this Berkshires property reached out, the home was located in a strong market but was not converting bookings consistently.
We rebuilt the listing structure, clarified the positioning, and implemented a dynamic pricing strategy designed to capture peak demand and improve booking flow.
Within two months of optimization, the property generated $39,767 in revenue, compared to $54,823 in the entire previous 12 months, putting the listing on pace for a $238,605 projected annual revenue trajectory.
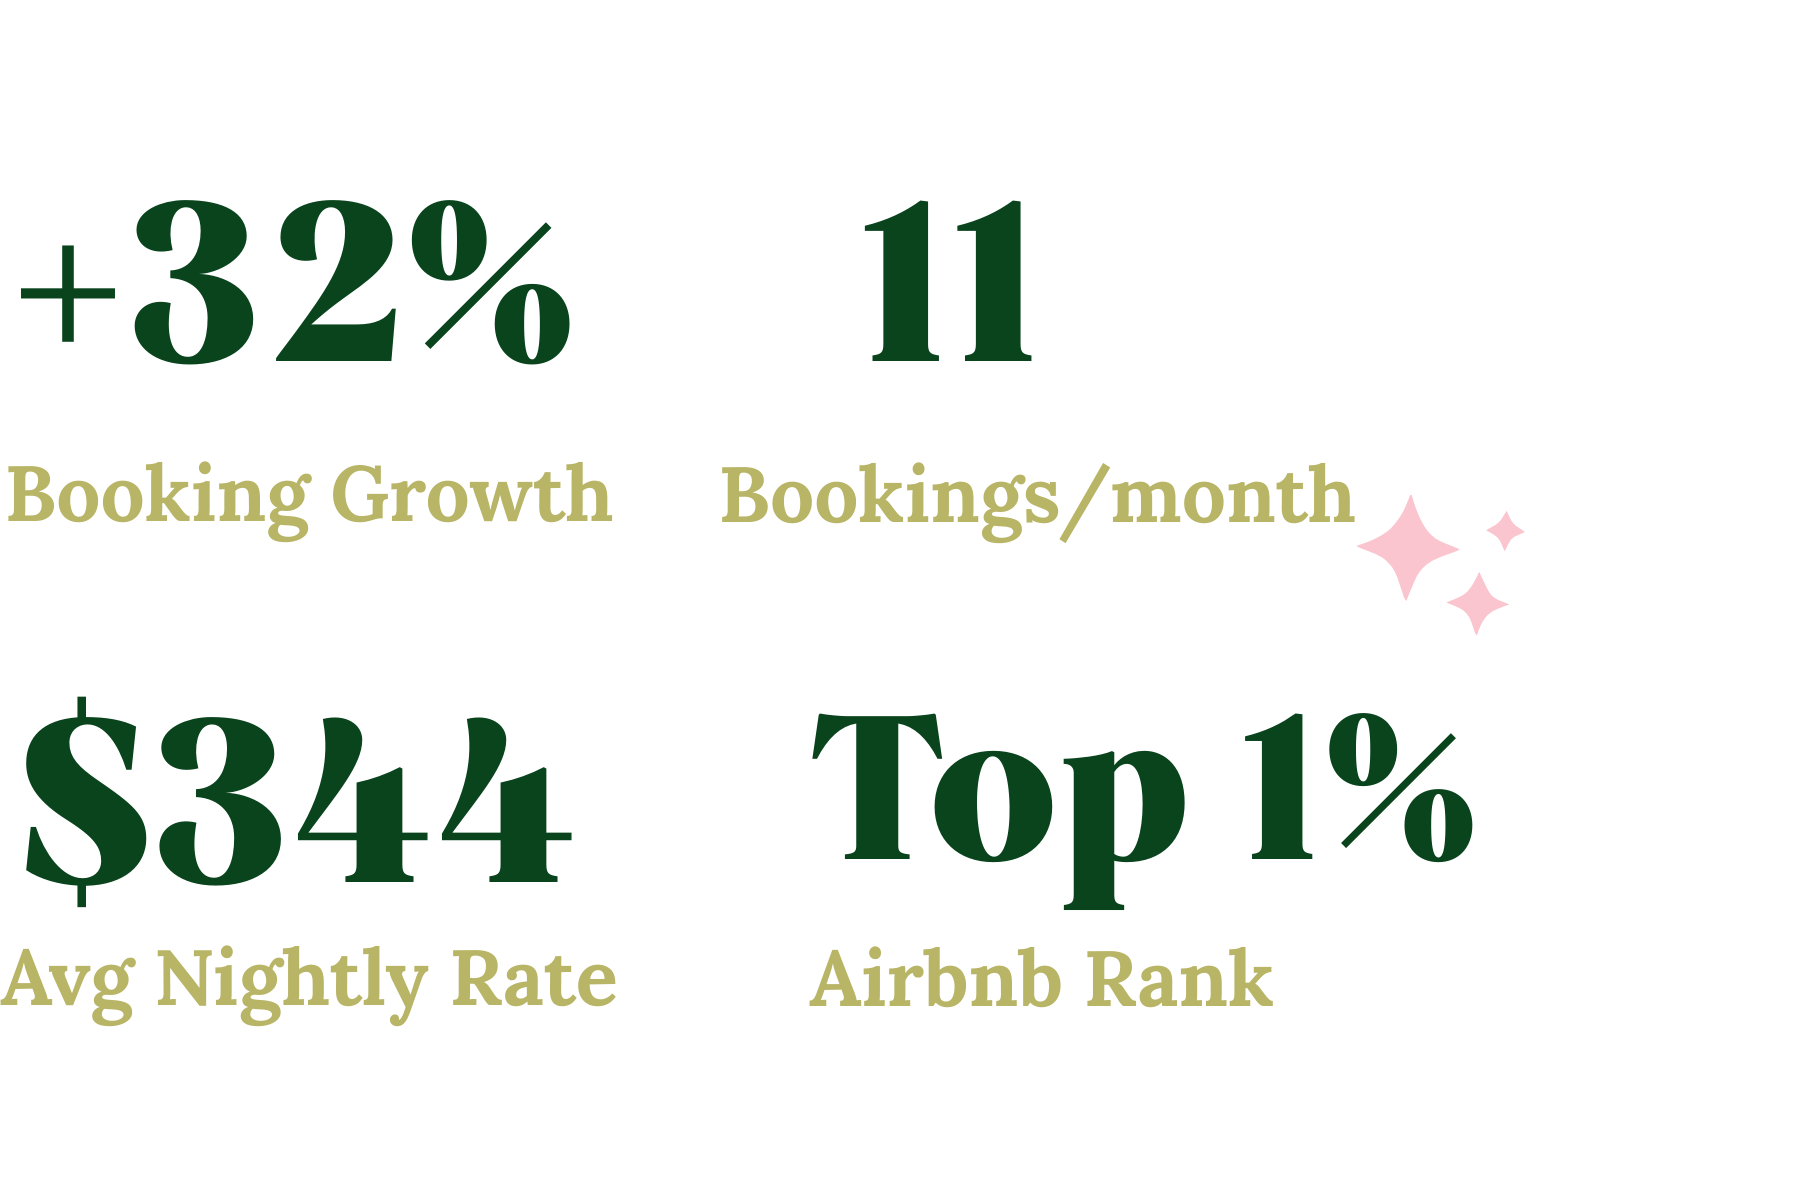
Case Study #3
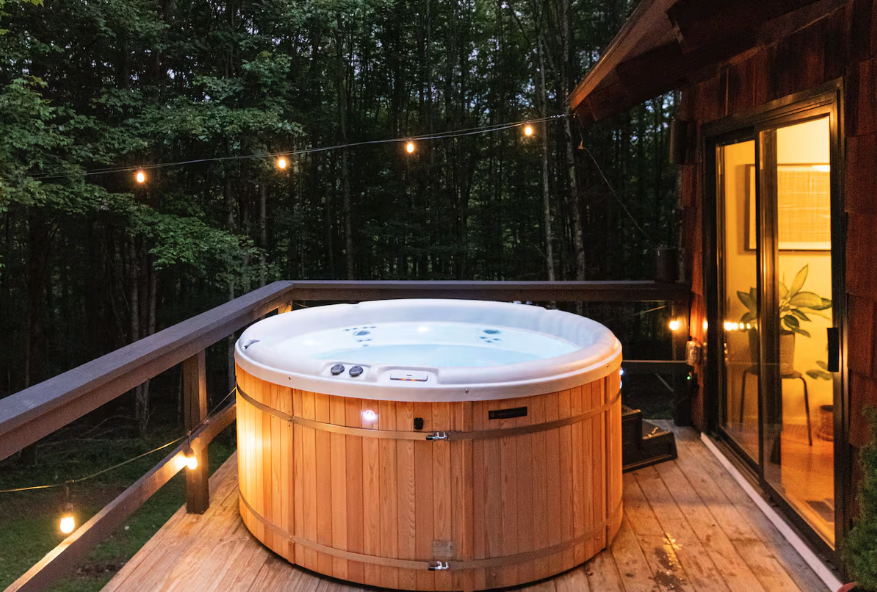
Destino Cabin
Catskills, New York
Higher rates, stronger monthly bookings
When the owner of this Catskills cabin reached out, the property was performing reasonably well, but it was leaving revenue on the table.
Pricing was not structured to capture peak demand, and the listing was not converting at the level it should. We implemented a dynamic pricing strategy focused on yield, refined the listing structure to improve conversion, and introduced a rules-based system to stabilize performance.
As a result, the property’s average nightly revenue increased from $292 to $344, while monthly bookings rose from 8.59 to 11.36, delivering stronger and more consistent revenue.
Different properties. Same results.
Across every listing, the same fundamentals apply: pricing, positioning, and presentation working together to drive performance.
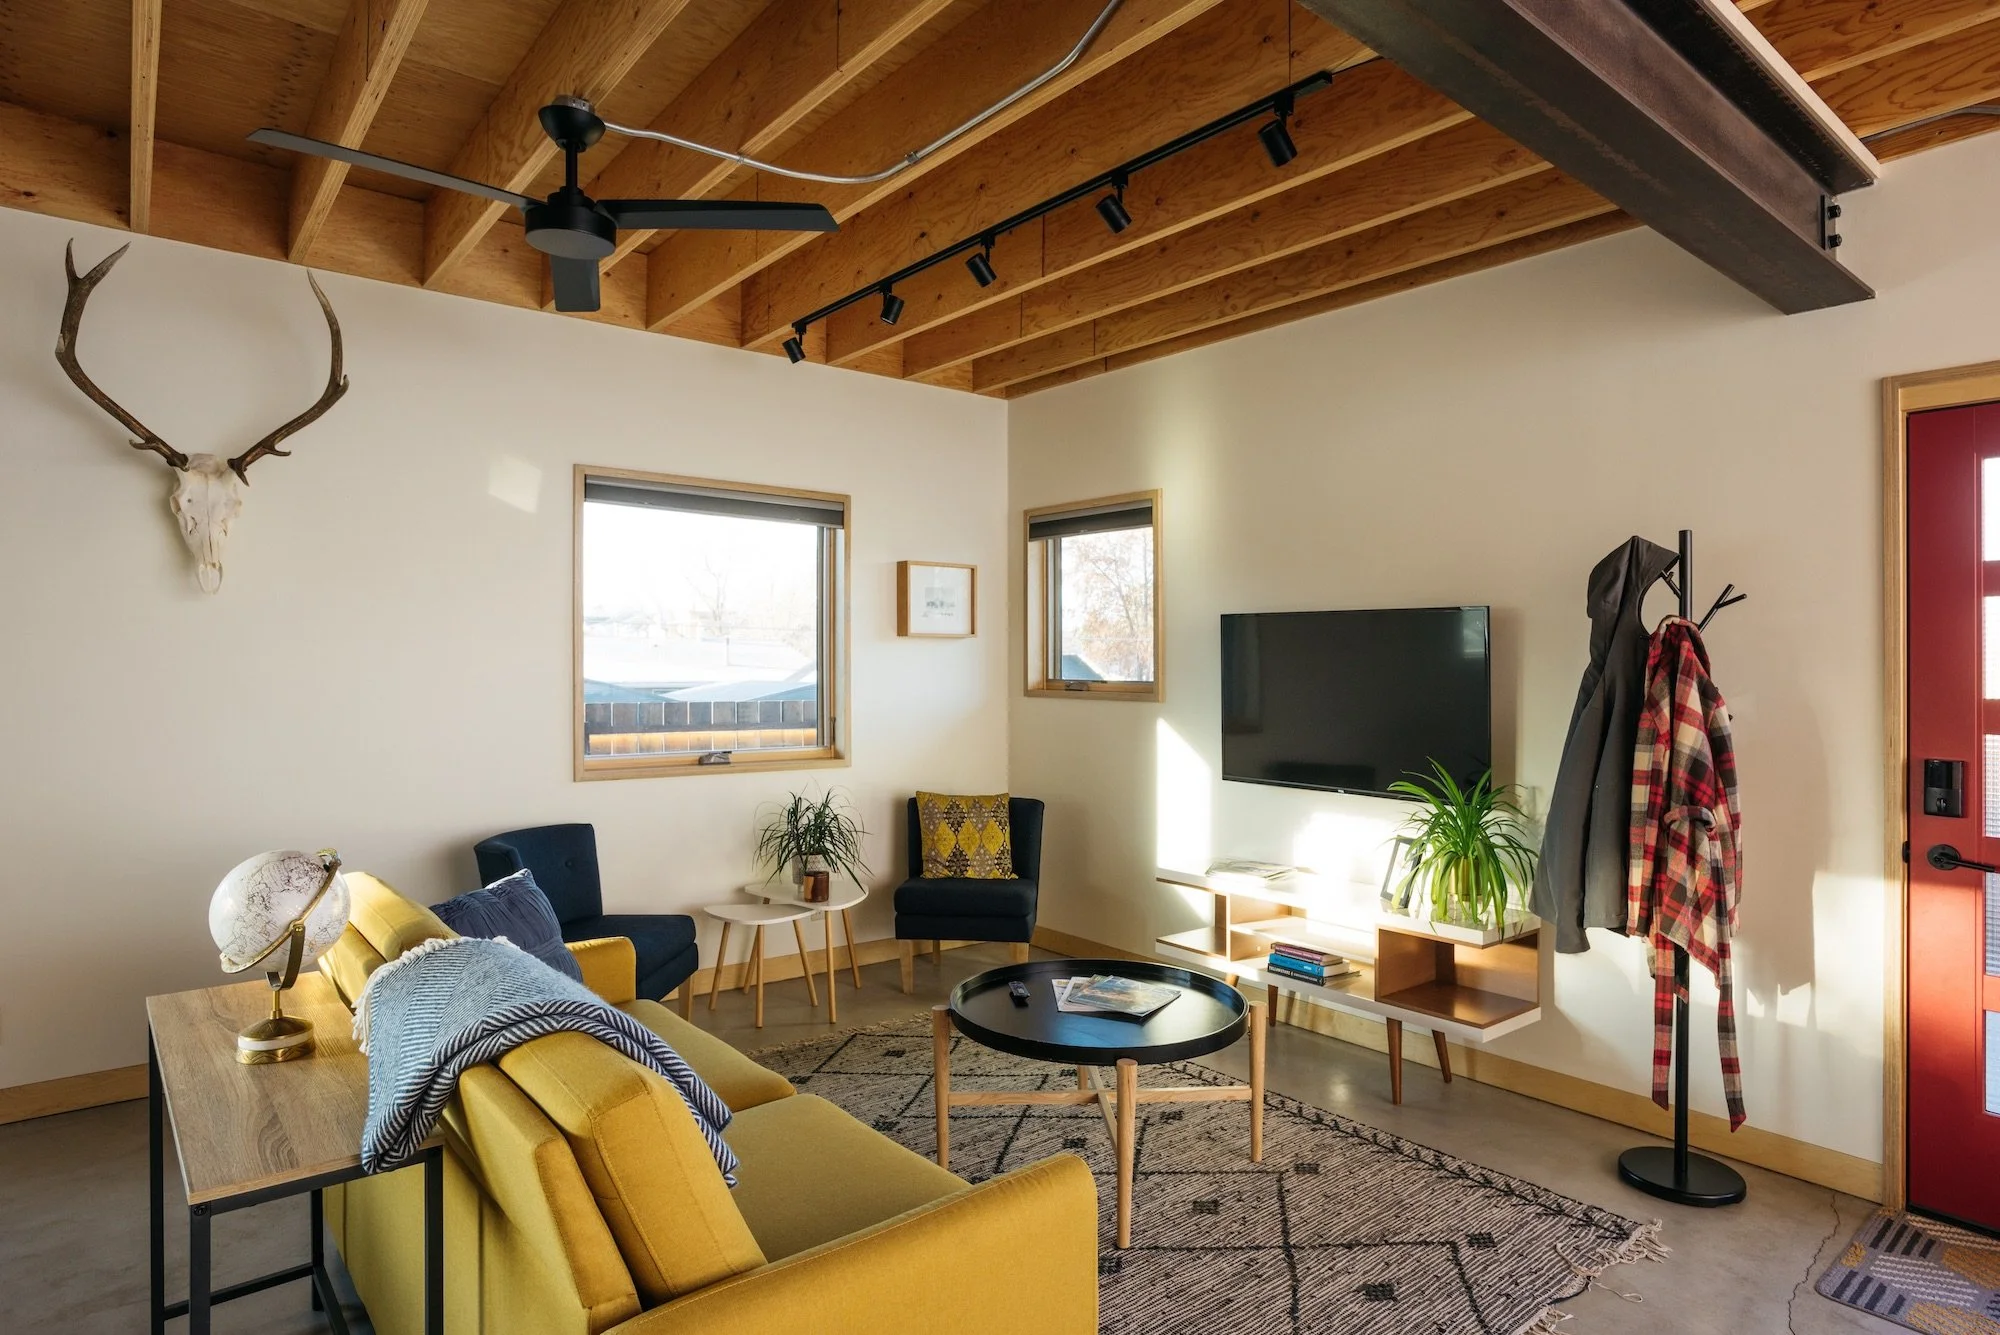
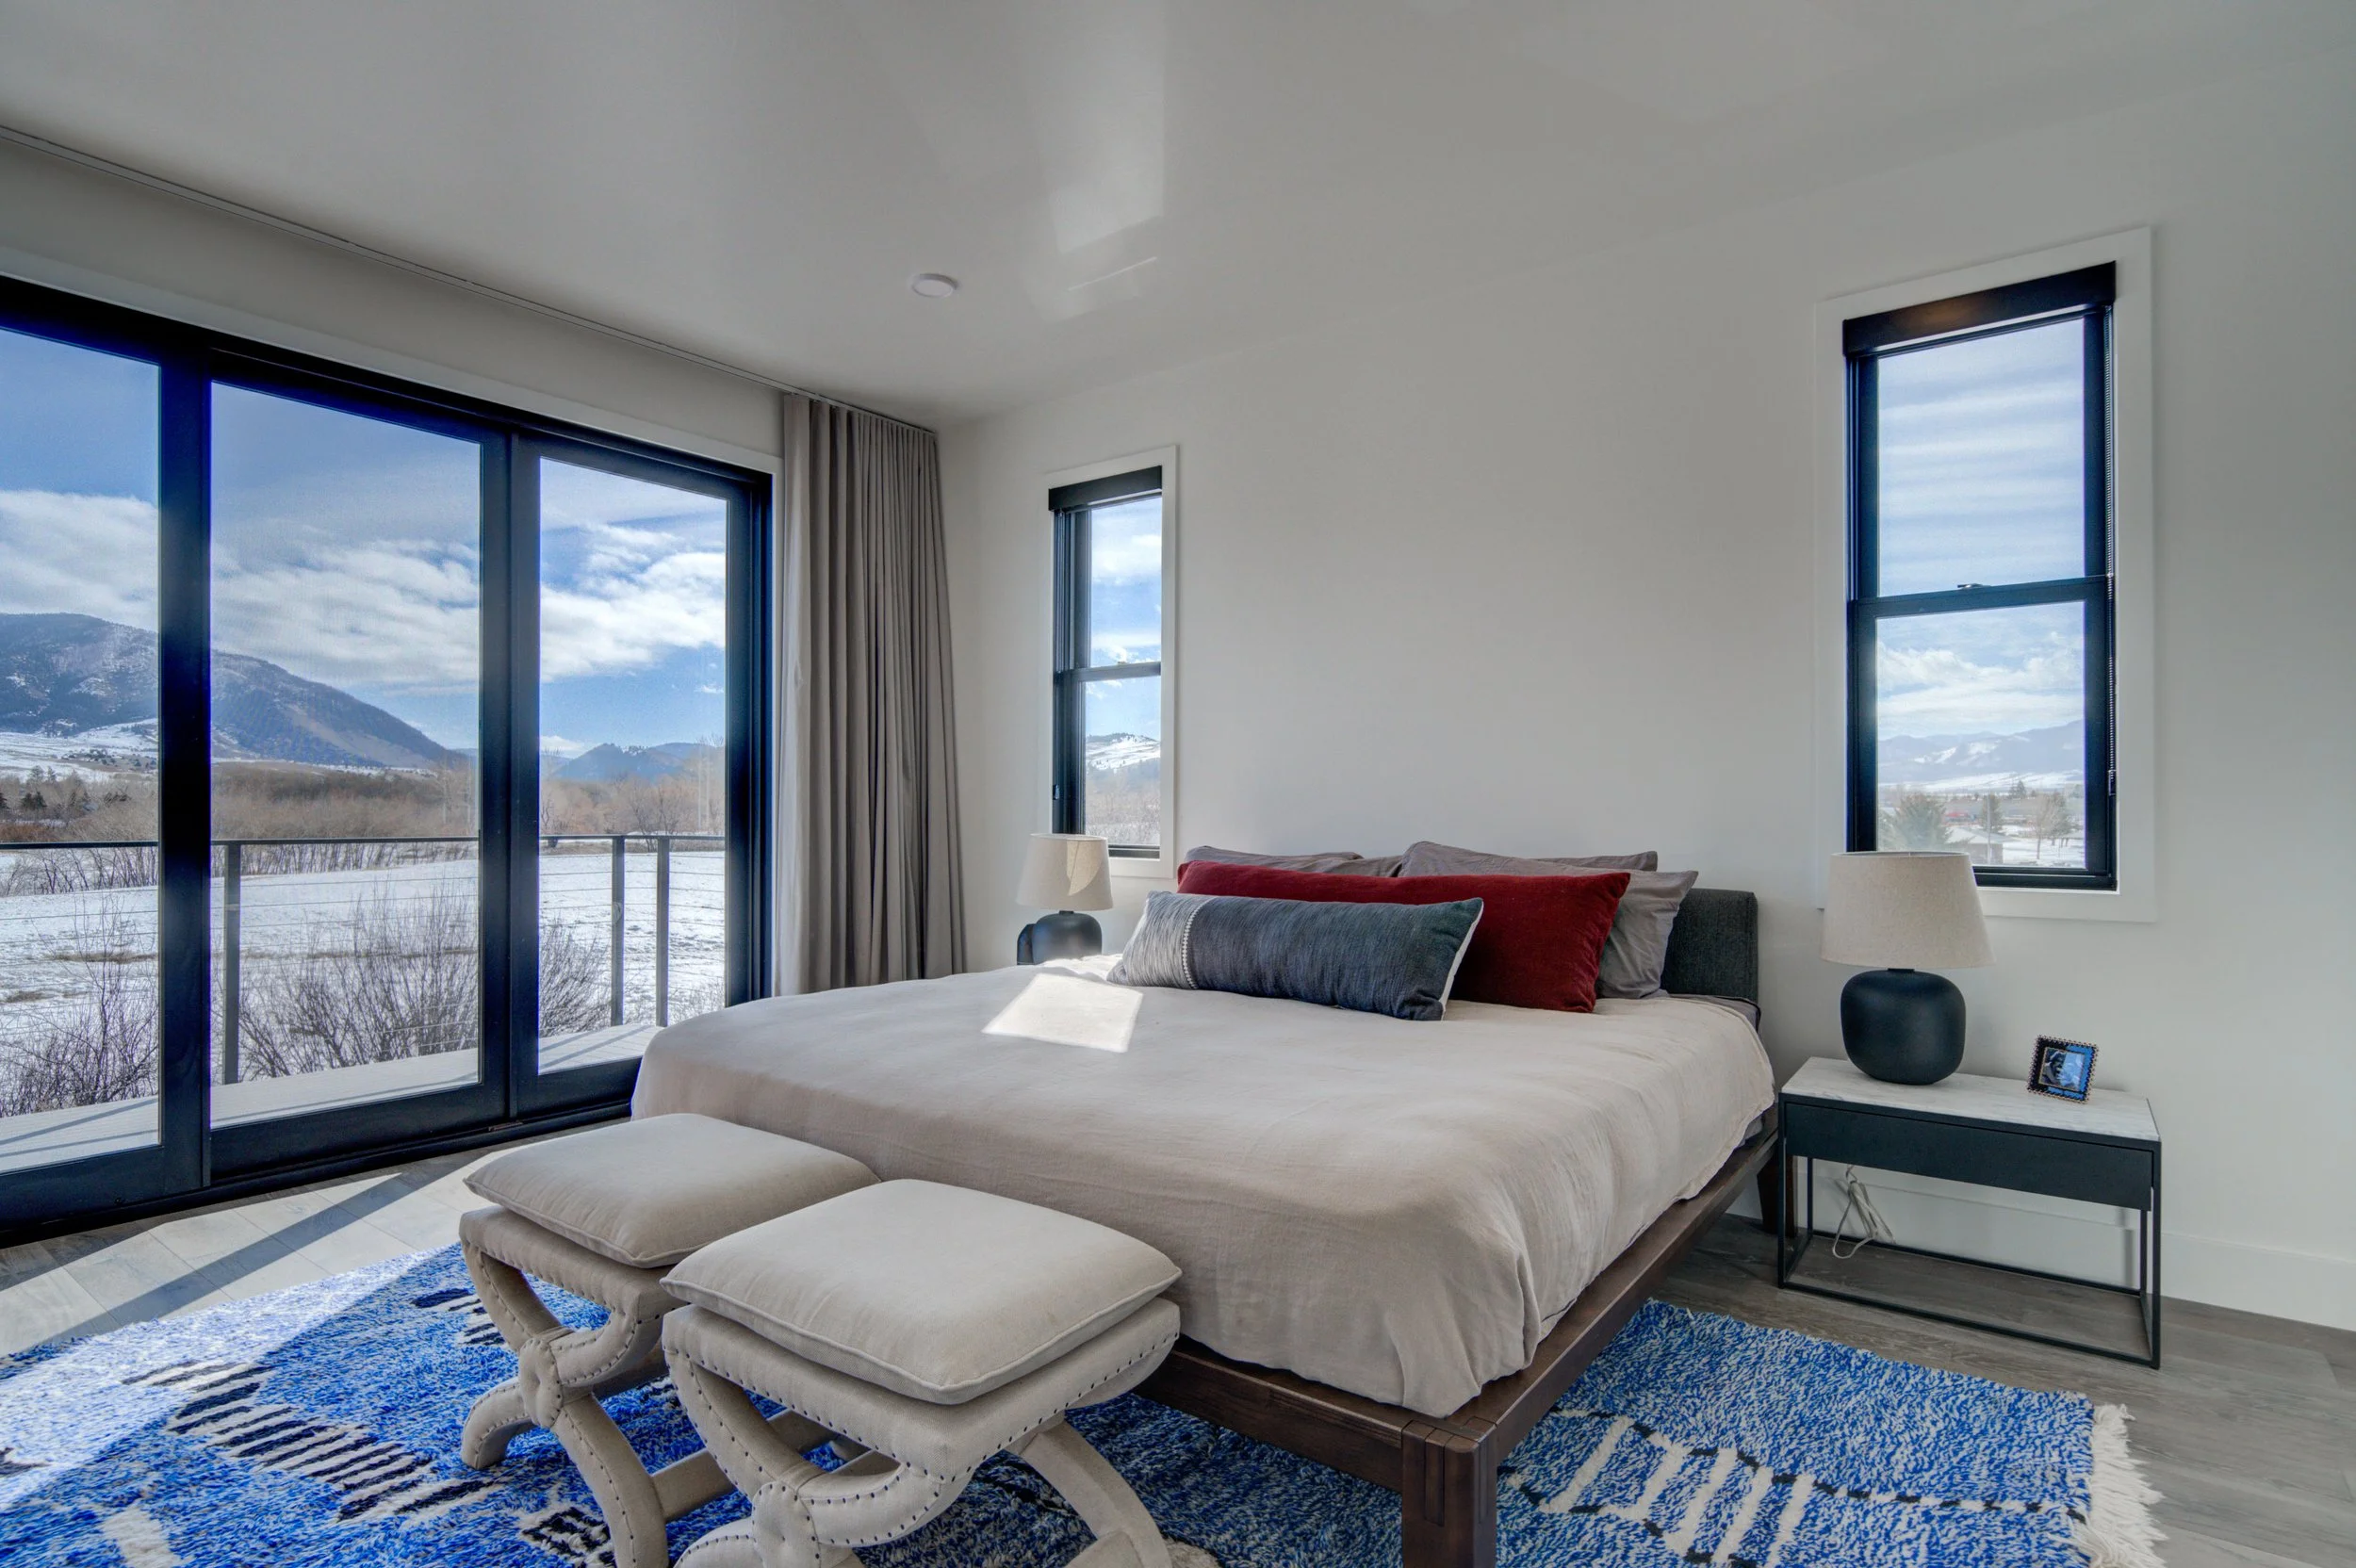
Case Study #4
Bozeman Guesthouse
Bozman, Montana
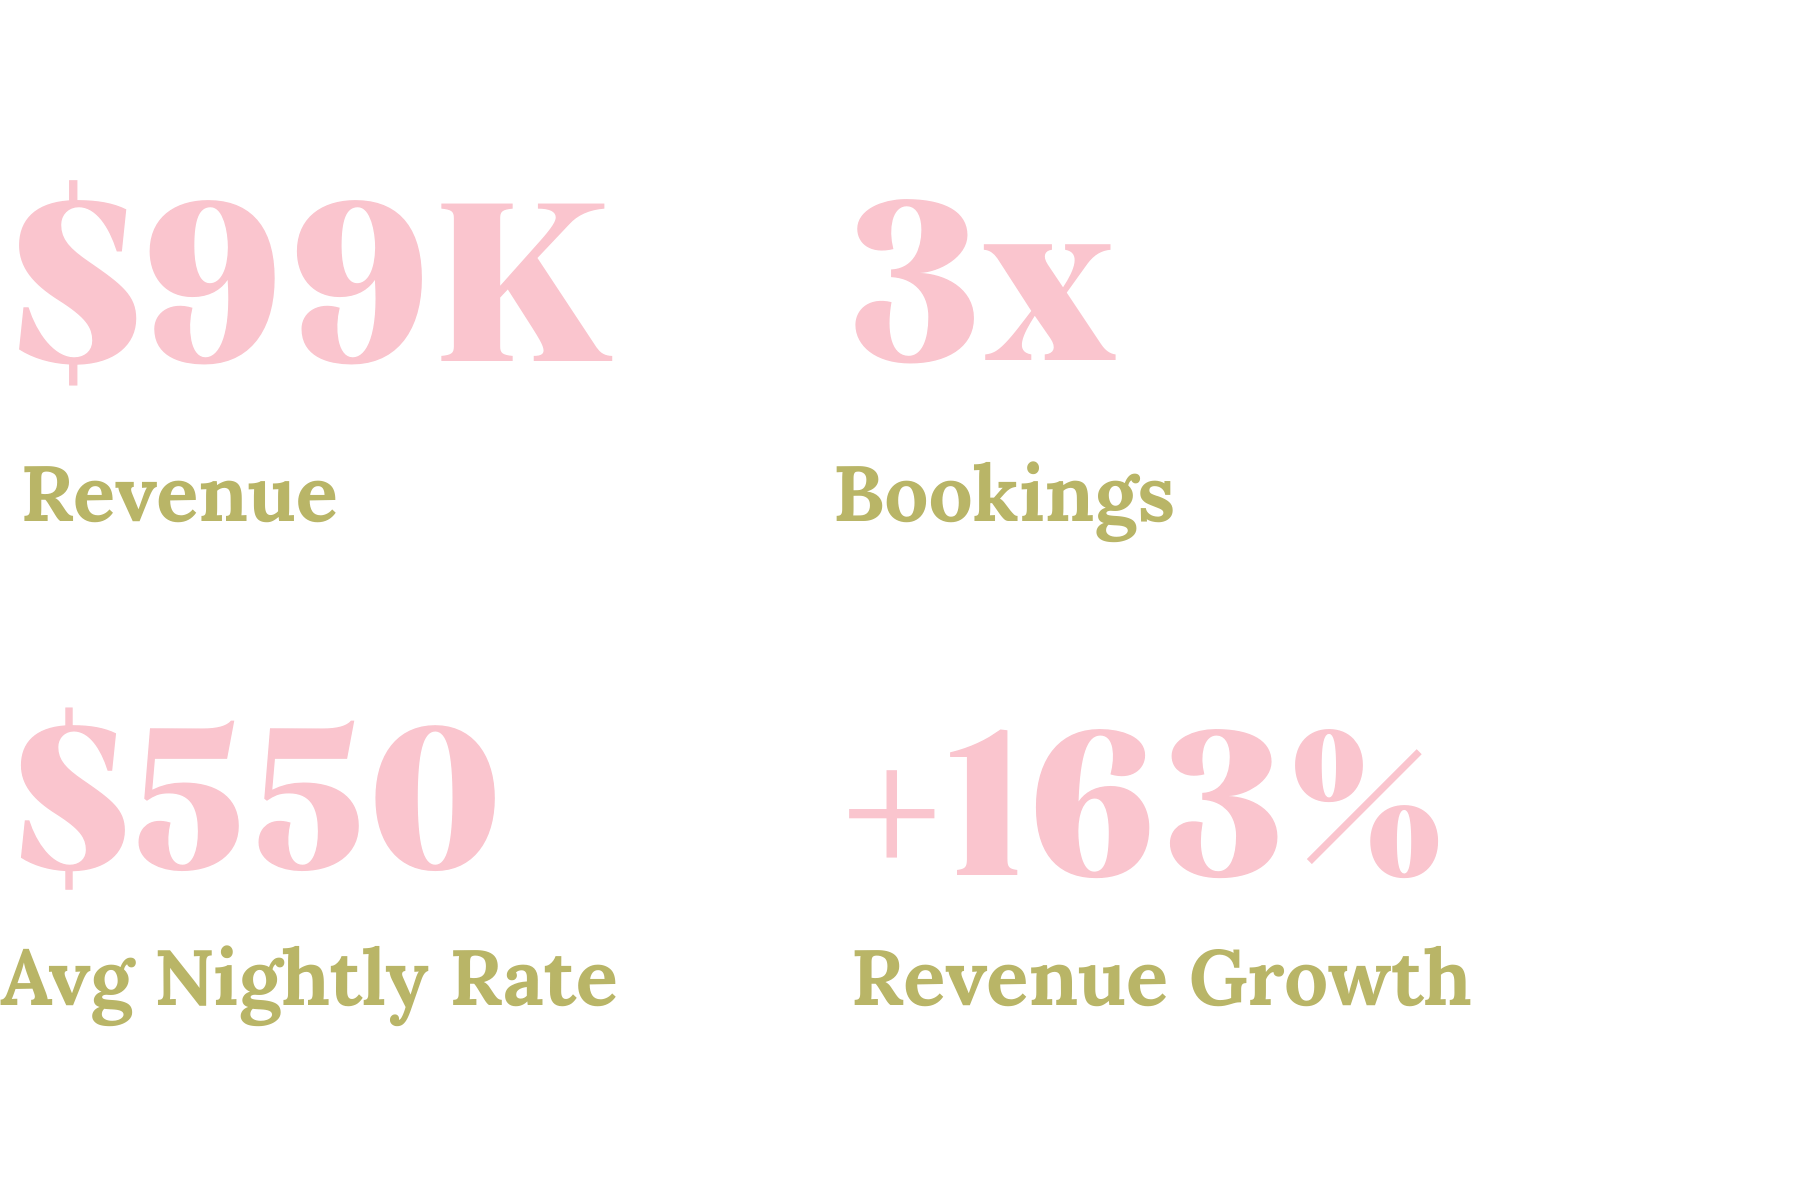
Portfolio growth to $99K/month
Static pricing and basic SEO were limiting visibility and revenue with their portfolio. We implemented a dynamic pricing strategy, upgraded the listing structure with conversion-focused SEO, and refined guest-facing details to build stronger booking confidence.
The result was a revenue increase from $37,636 to $99,003, alongside improved ranking, stronger visibility, and greater booking momentum.
Case Study #5
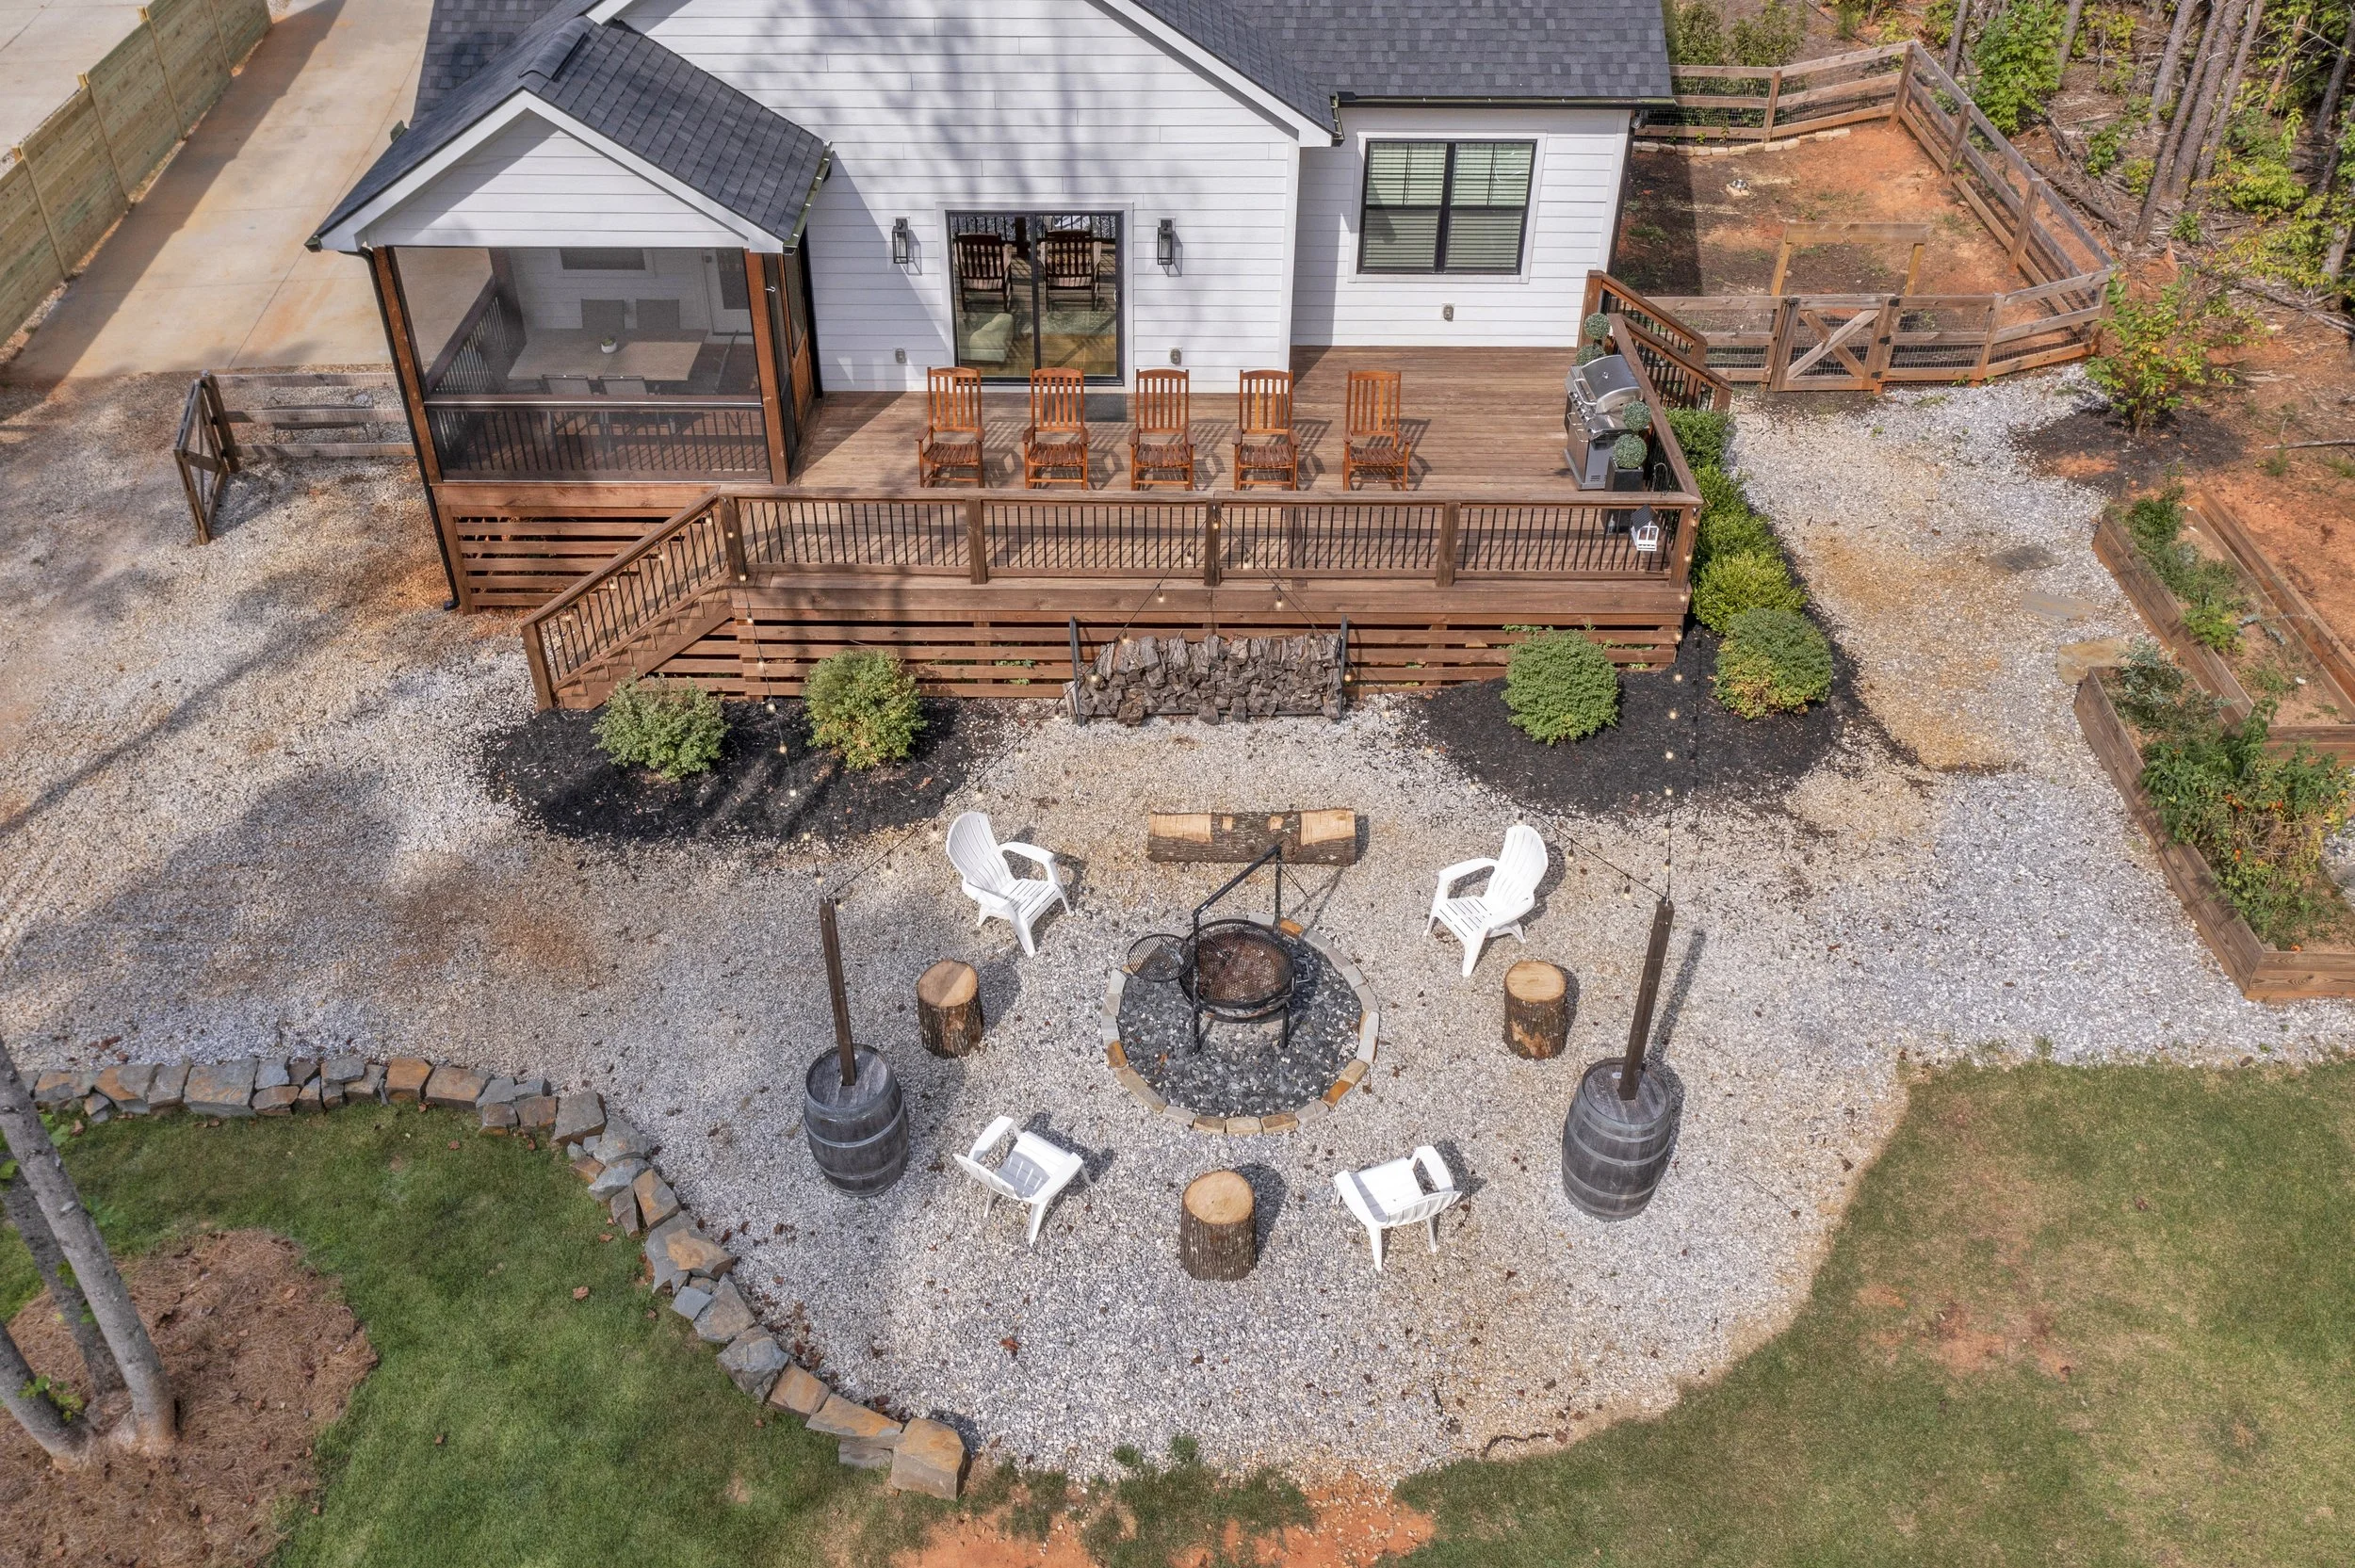
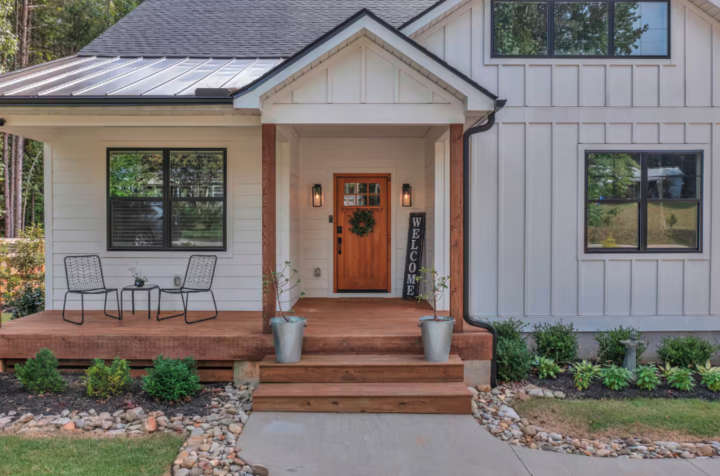
Emmy’s House
Greenville, South Carolina
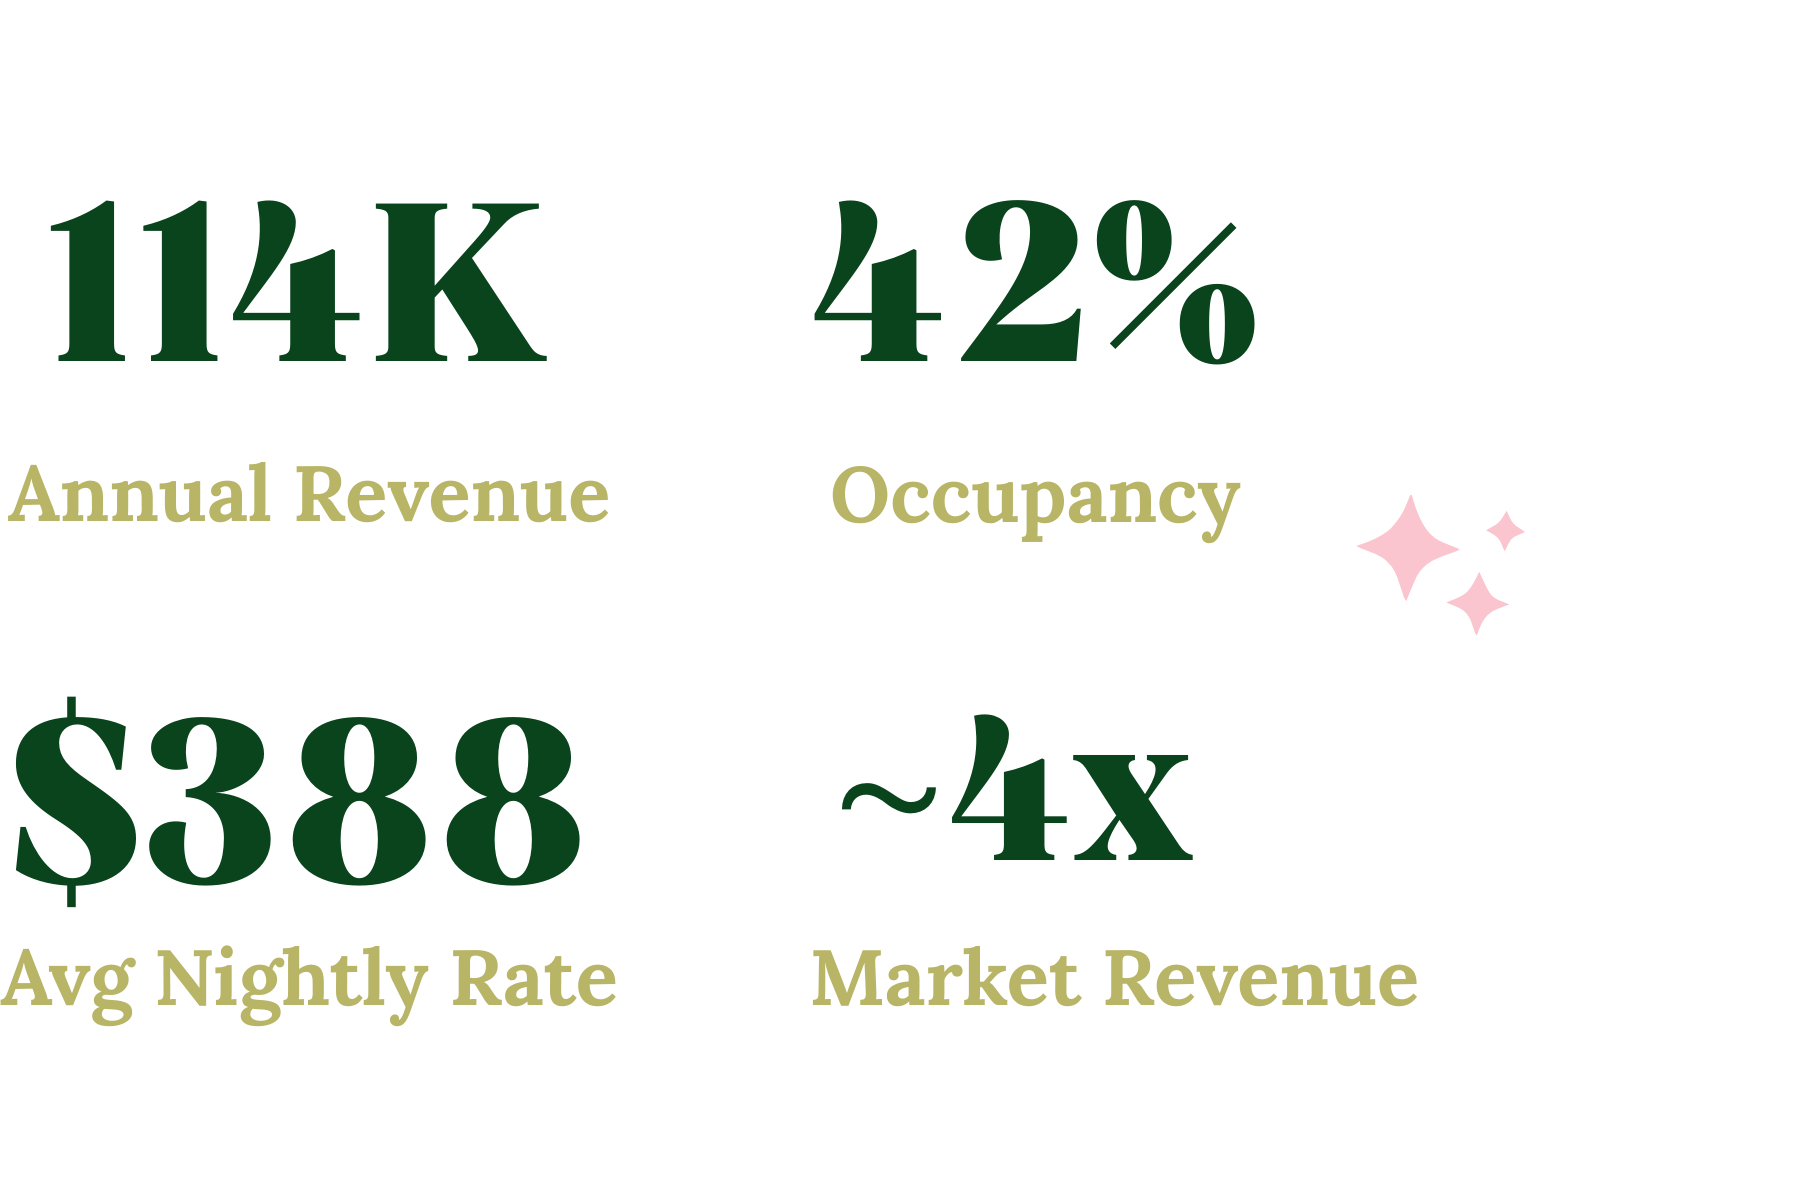
4x market revenue through premium positioning
We implemented a pricing strategy designed to protect ADR and attract the right guests. The listing was structured around conversion and positioning, allowing the home to compete above market rates from day one.
The result was $114,939 in annual revenue compared to the market average of approximately $29,300, with an average nightly rate of $388 versus the market’s $181, achieved with intentionally lower occupancy.
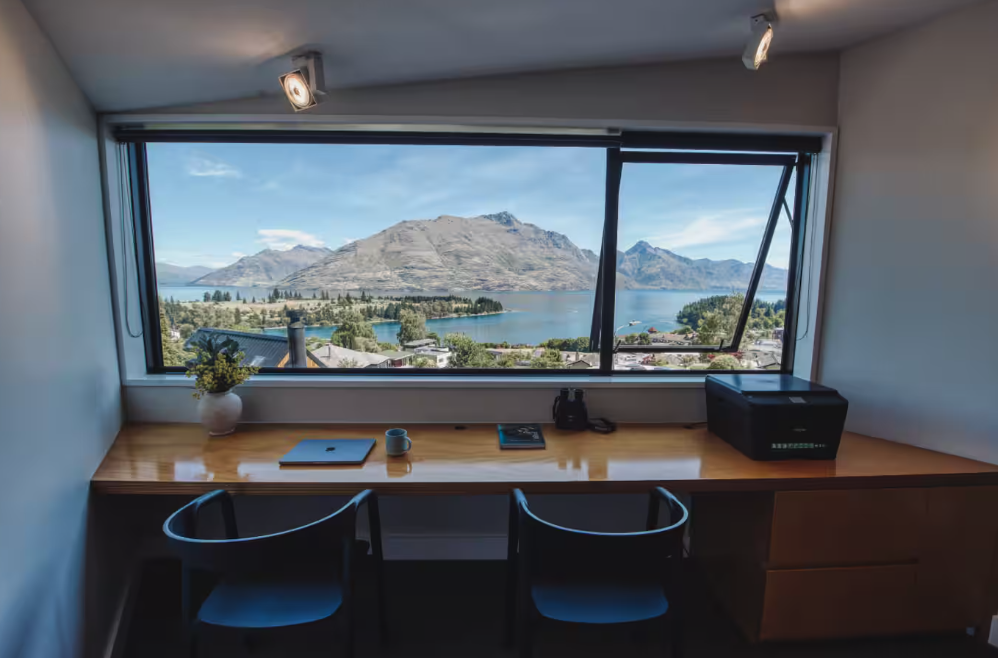
Case Study #6
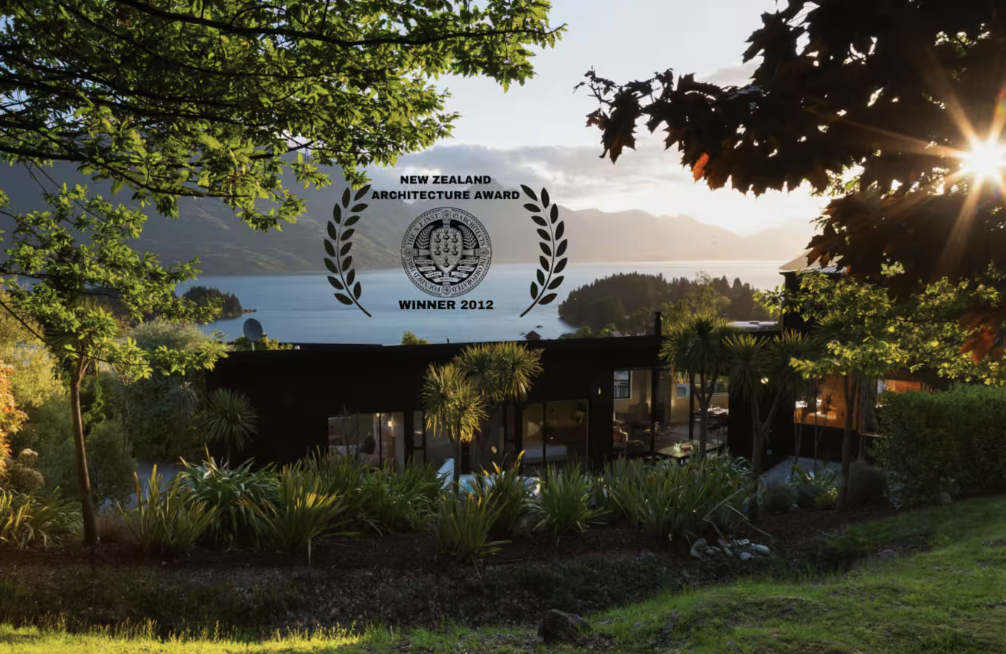
Snowbird
Queenstown, New Zealand
Fragmented setup to 4x revenue growth
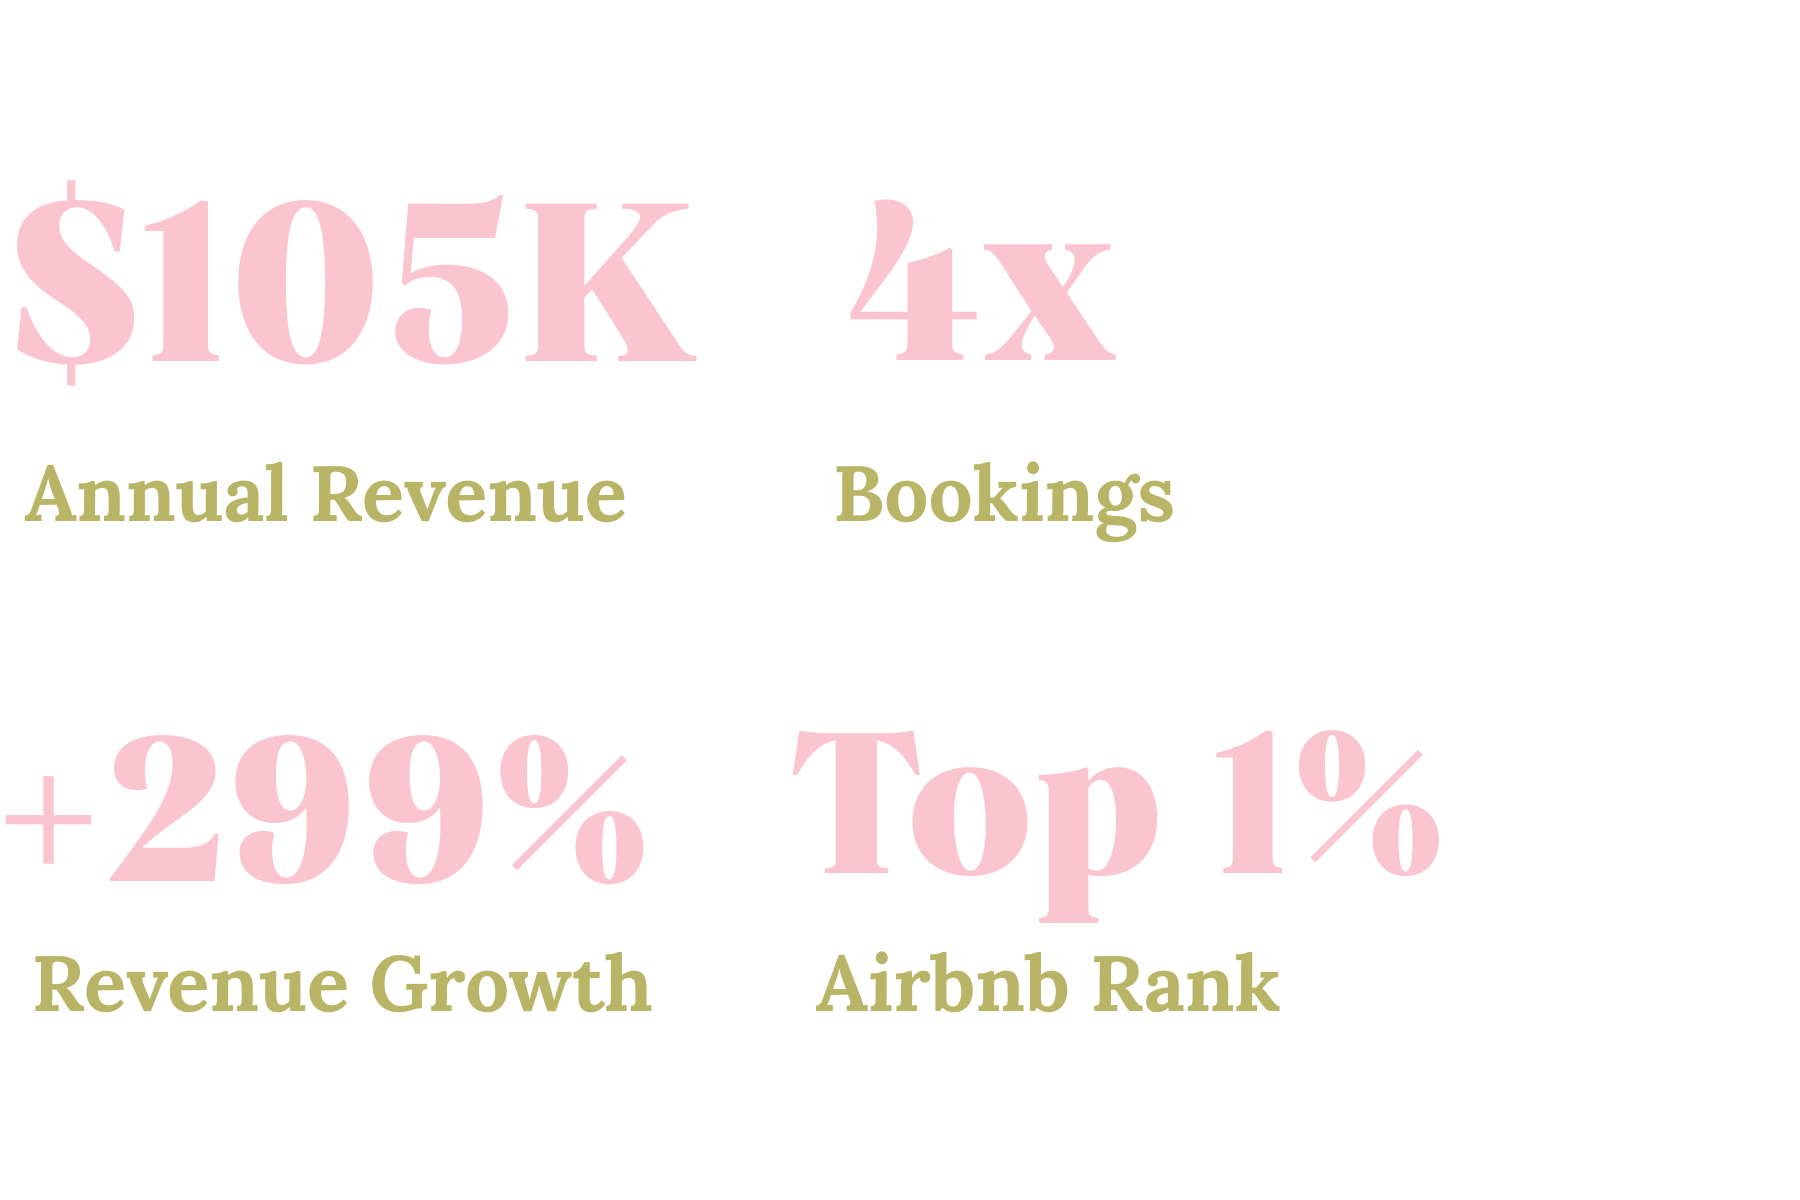
We relaunched the listing from scratch, rebuilt the SEO and conversion structure, expanded distribution with VRBO, and implemented systems to support multi-channel management and direct bookings.
Within the first year, annual revenue increased from $26,523 to $105,927, supported by stronger visibility, broader platform reach, and a more streamlined operational foundation.
See exactly what your listing is leaving on the table.
Submit your listing link and we will review pricing, positioning, content, and distribution.
